User Guide
Welcome to Helios-Platform’s User Guide!
Dashboard
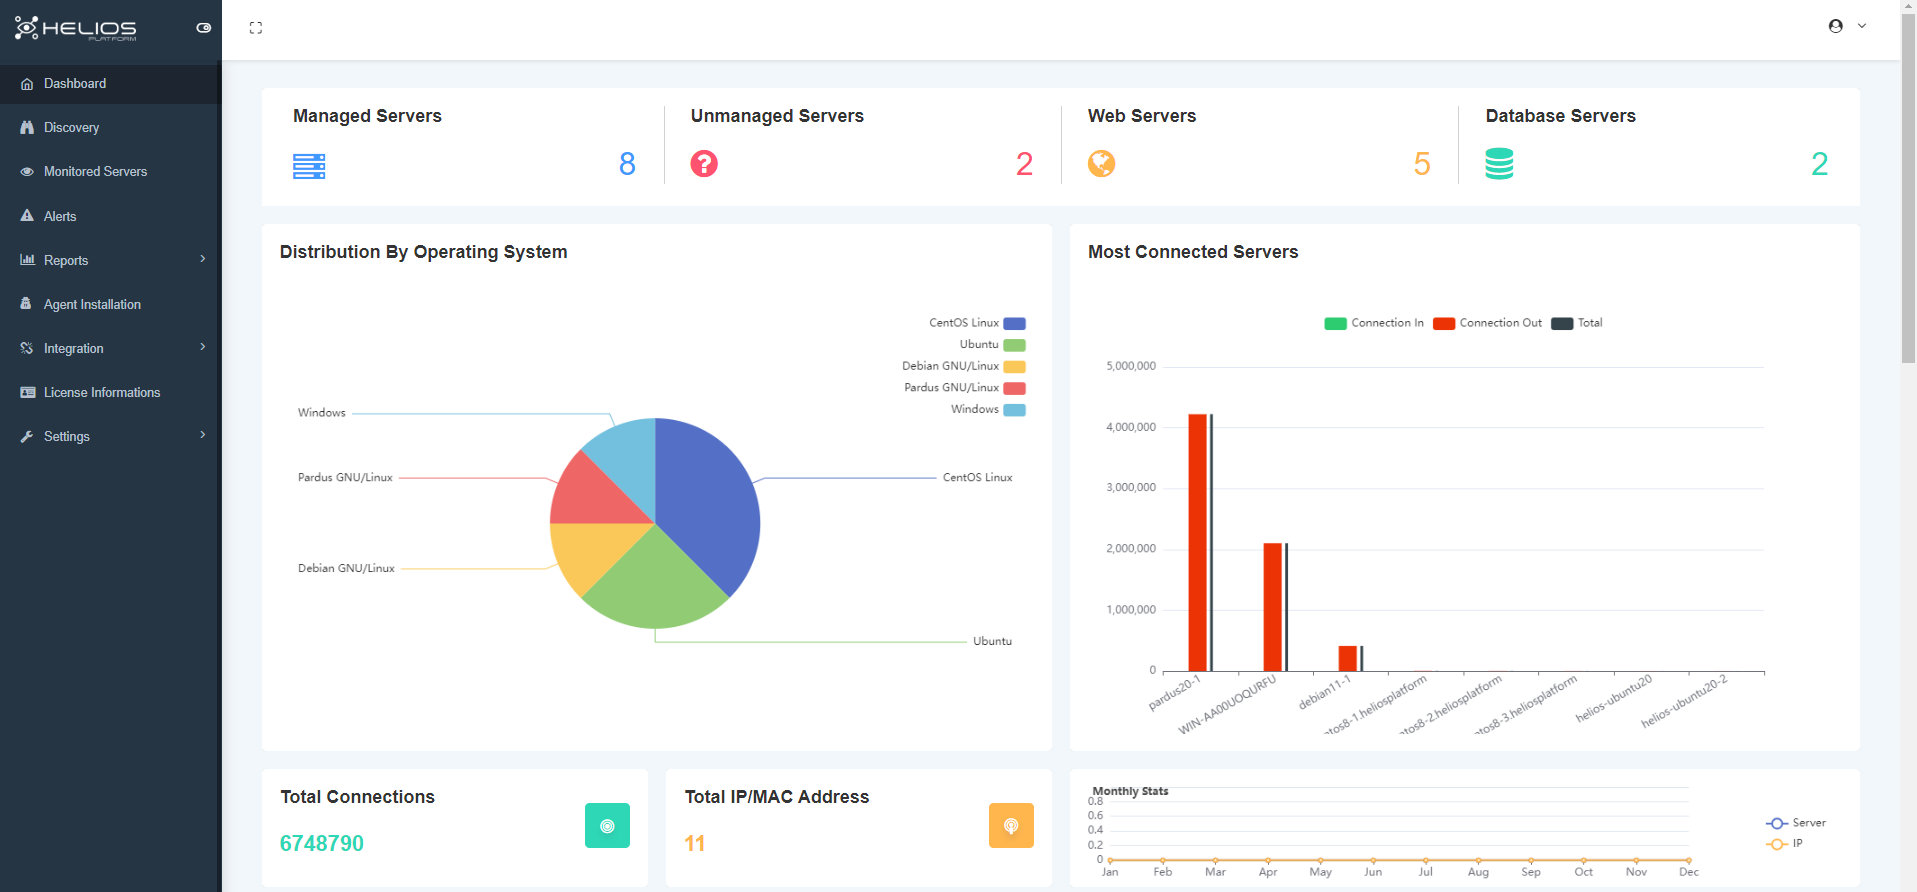
You can set what you want to see on the Dashboard screen from Settings > Dashboard Settings
Discovery
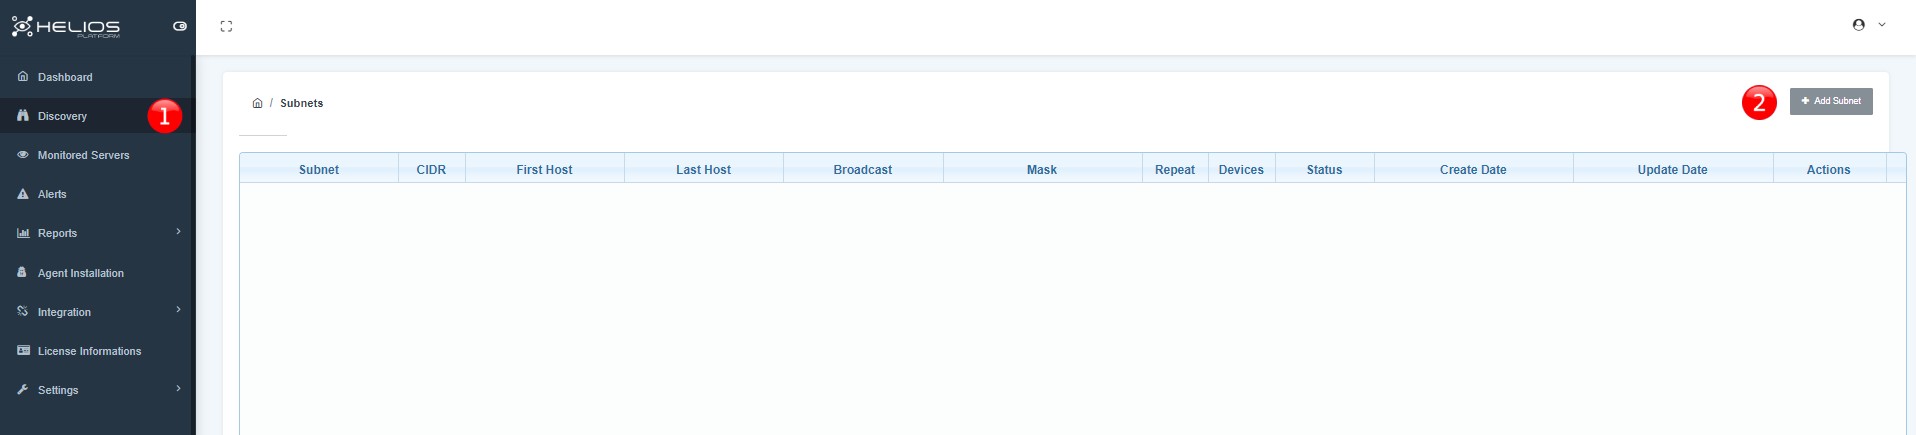
- Click to pass discovery section.
- Click to add subnet.
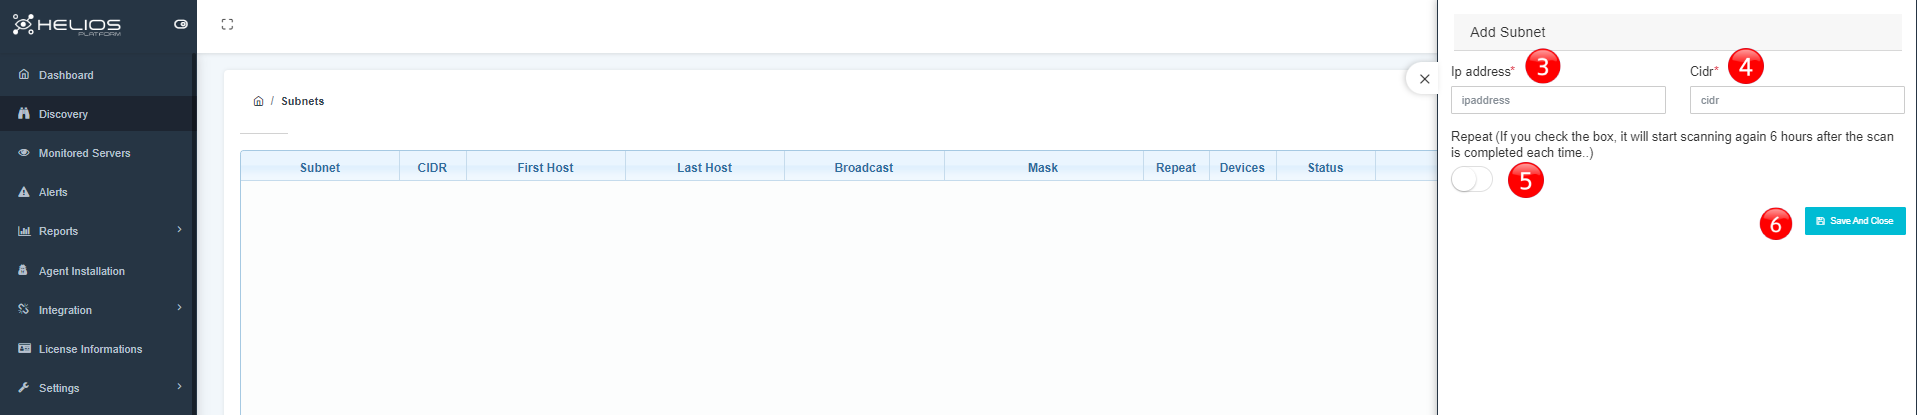
- Enter the IP address.
- Enter the CIDR.
- Activate button if you want to repeat.
- Save and close.
Monitored Servers
Our servers with Agent installed are listed on the Monitored servers page.
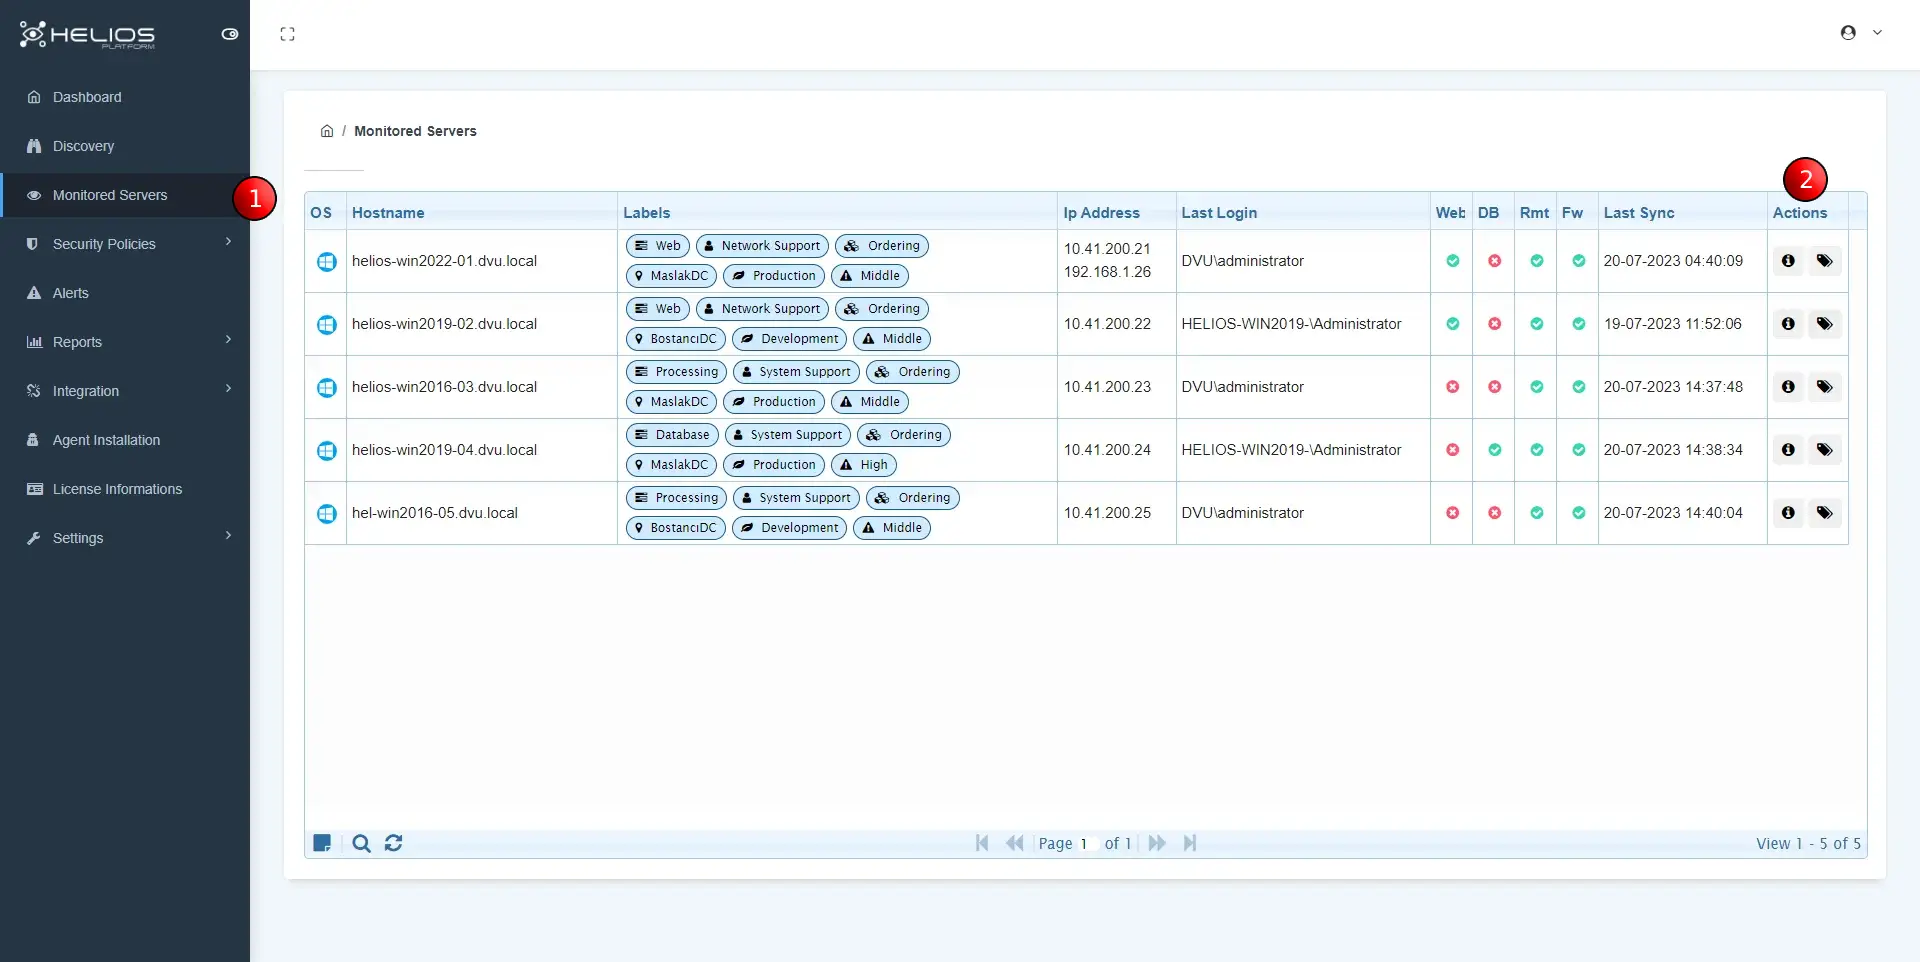
- OS: The operating system is indicated by the logo (Windows, Redhat, Ubuntu, Pardus etc.)
- Hostname: device name (hostname information is shown on devices included in the domain)
- Labels:
- Role: The role played by the device (Web, Database, Processing, etc.)
- Owner: Who owns the device (User or Group)
- Application: Name of the application running on the device
- Location: The physical/virtual location of the device.
- Environment: The intended use of the device (Production, Developmnet etc.)
- Criticality: Device priority and severity (High, Low, etc.)
- Tags: More than one definition can be made for device-specific separator definitions to be used in filters.
- Ip Address: Shows the IP addresses defined on the device.
- Last Login: Shows the last login user information on the device.
- Web: Shows the application information that is broadcasting Web on the device.
- DB: Shows the application information that provides Database service on the device.
- Rmt: Indicates that the remote connection is on/off (RDP, SSH).
- Fw: Indicates that the local firewall is on/off.
- Last Sync: Shows the time information of the last data sent from the device.
Note
- Click the first button to view device detail.
- Click the second button to add a label to the device.
Labeling the device
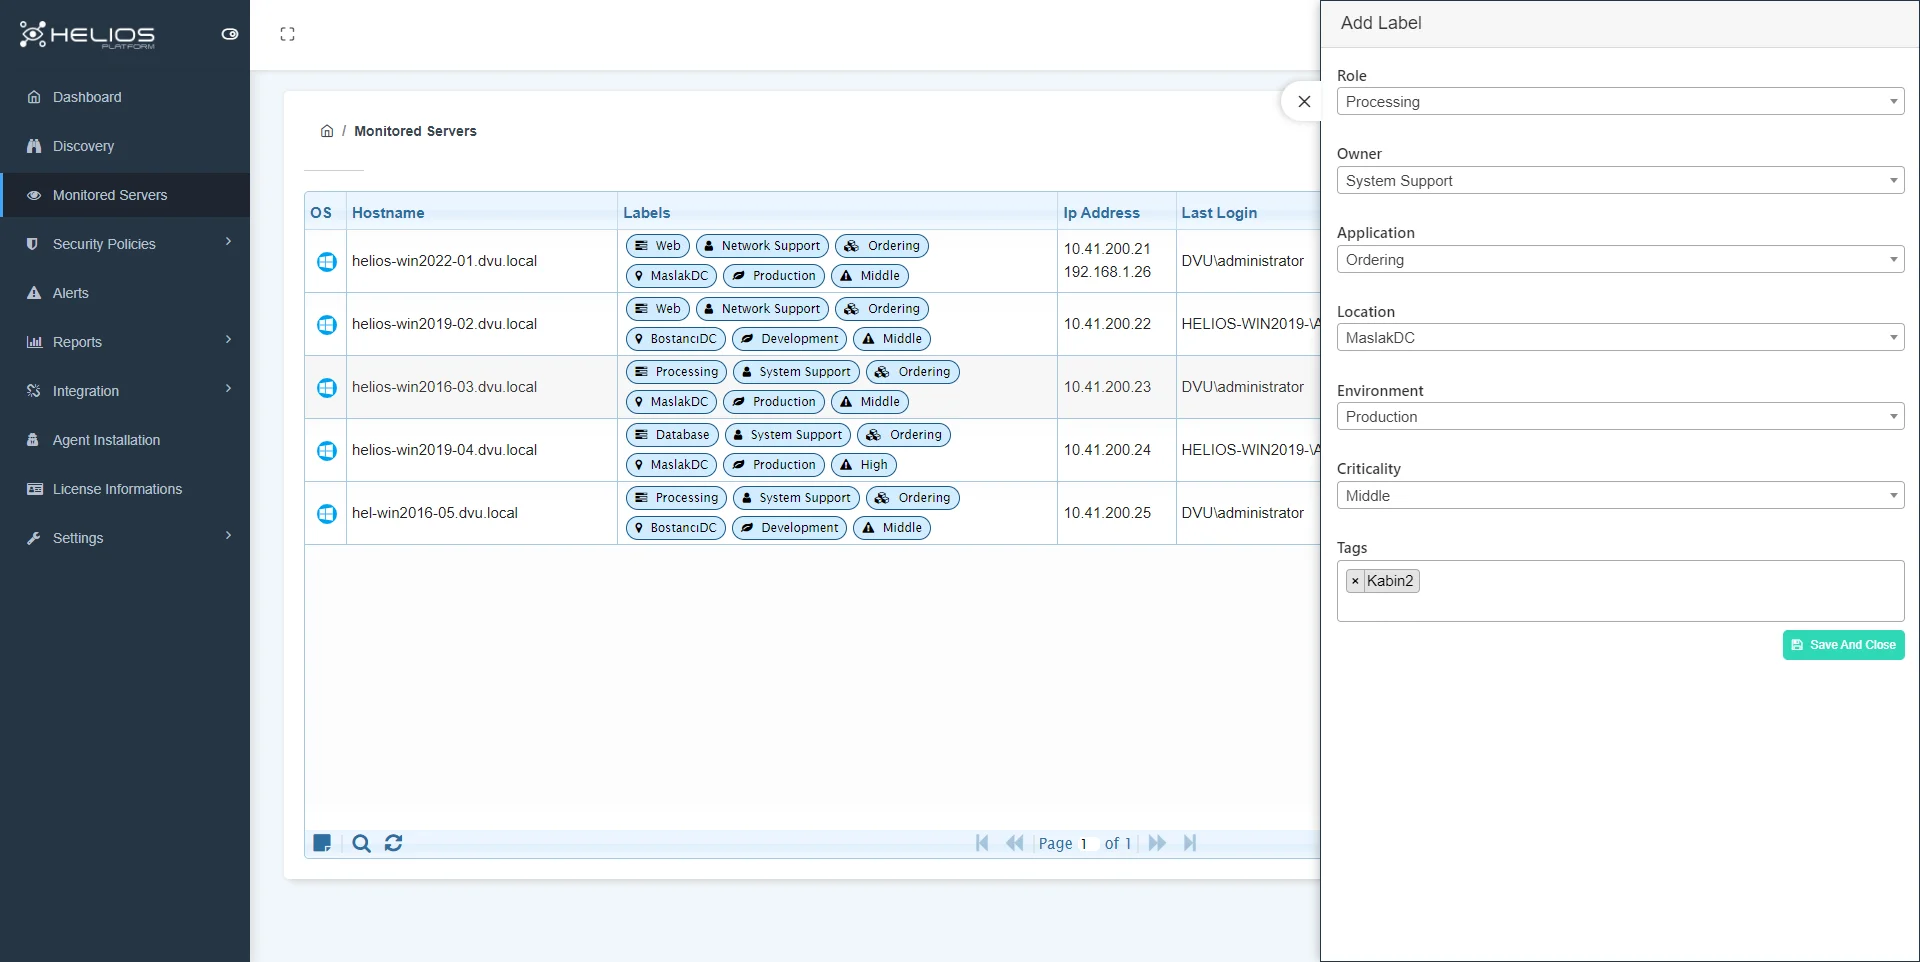
Warning
It is mandatory to assign labels to devices for microsegmentation and report filtering.
Device Details
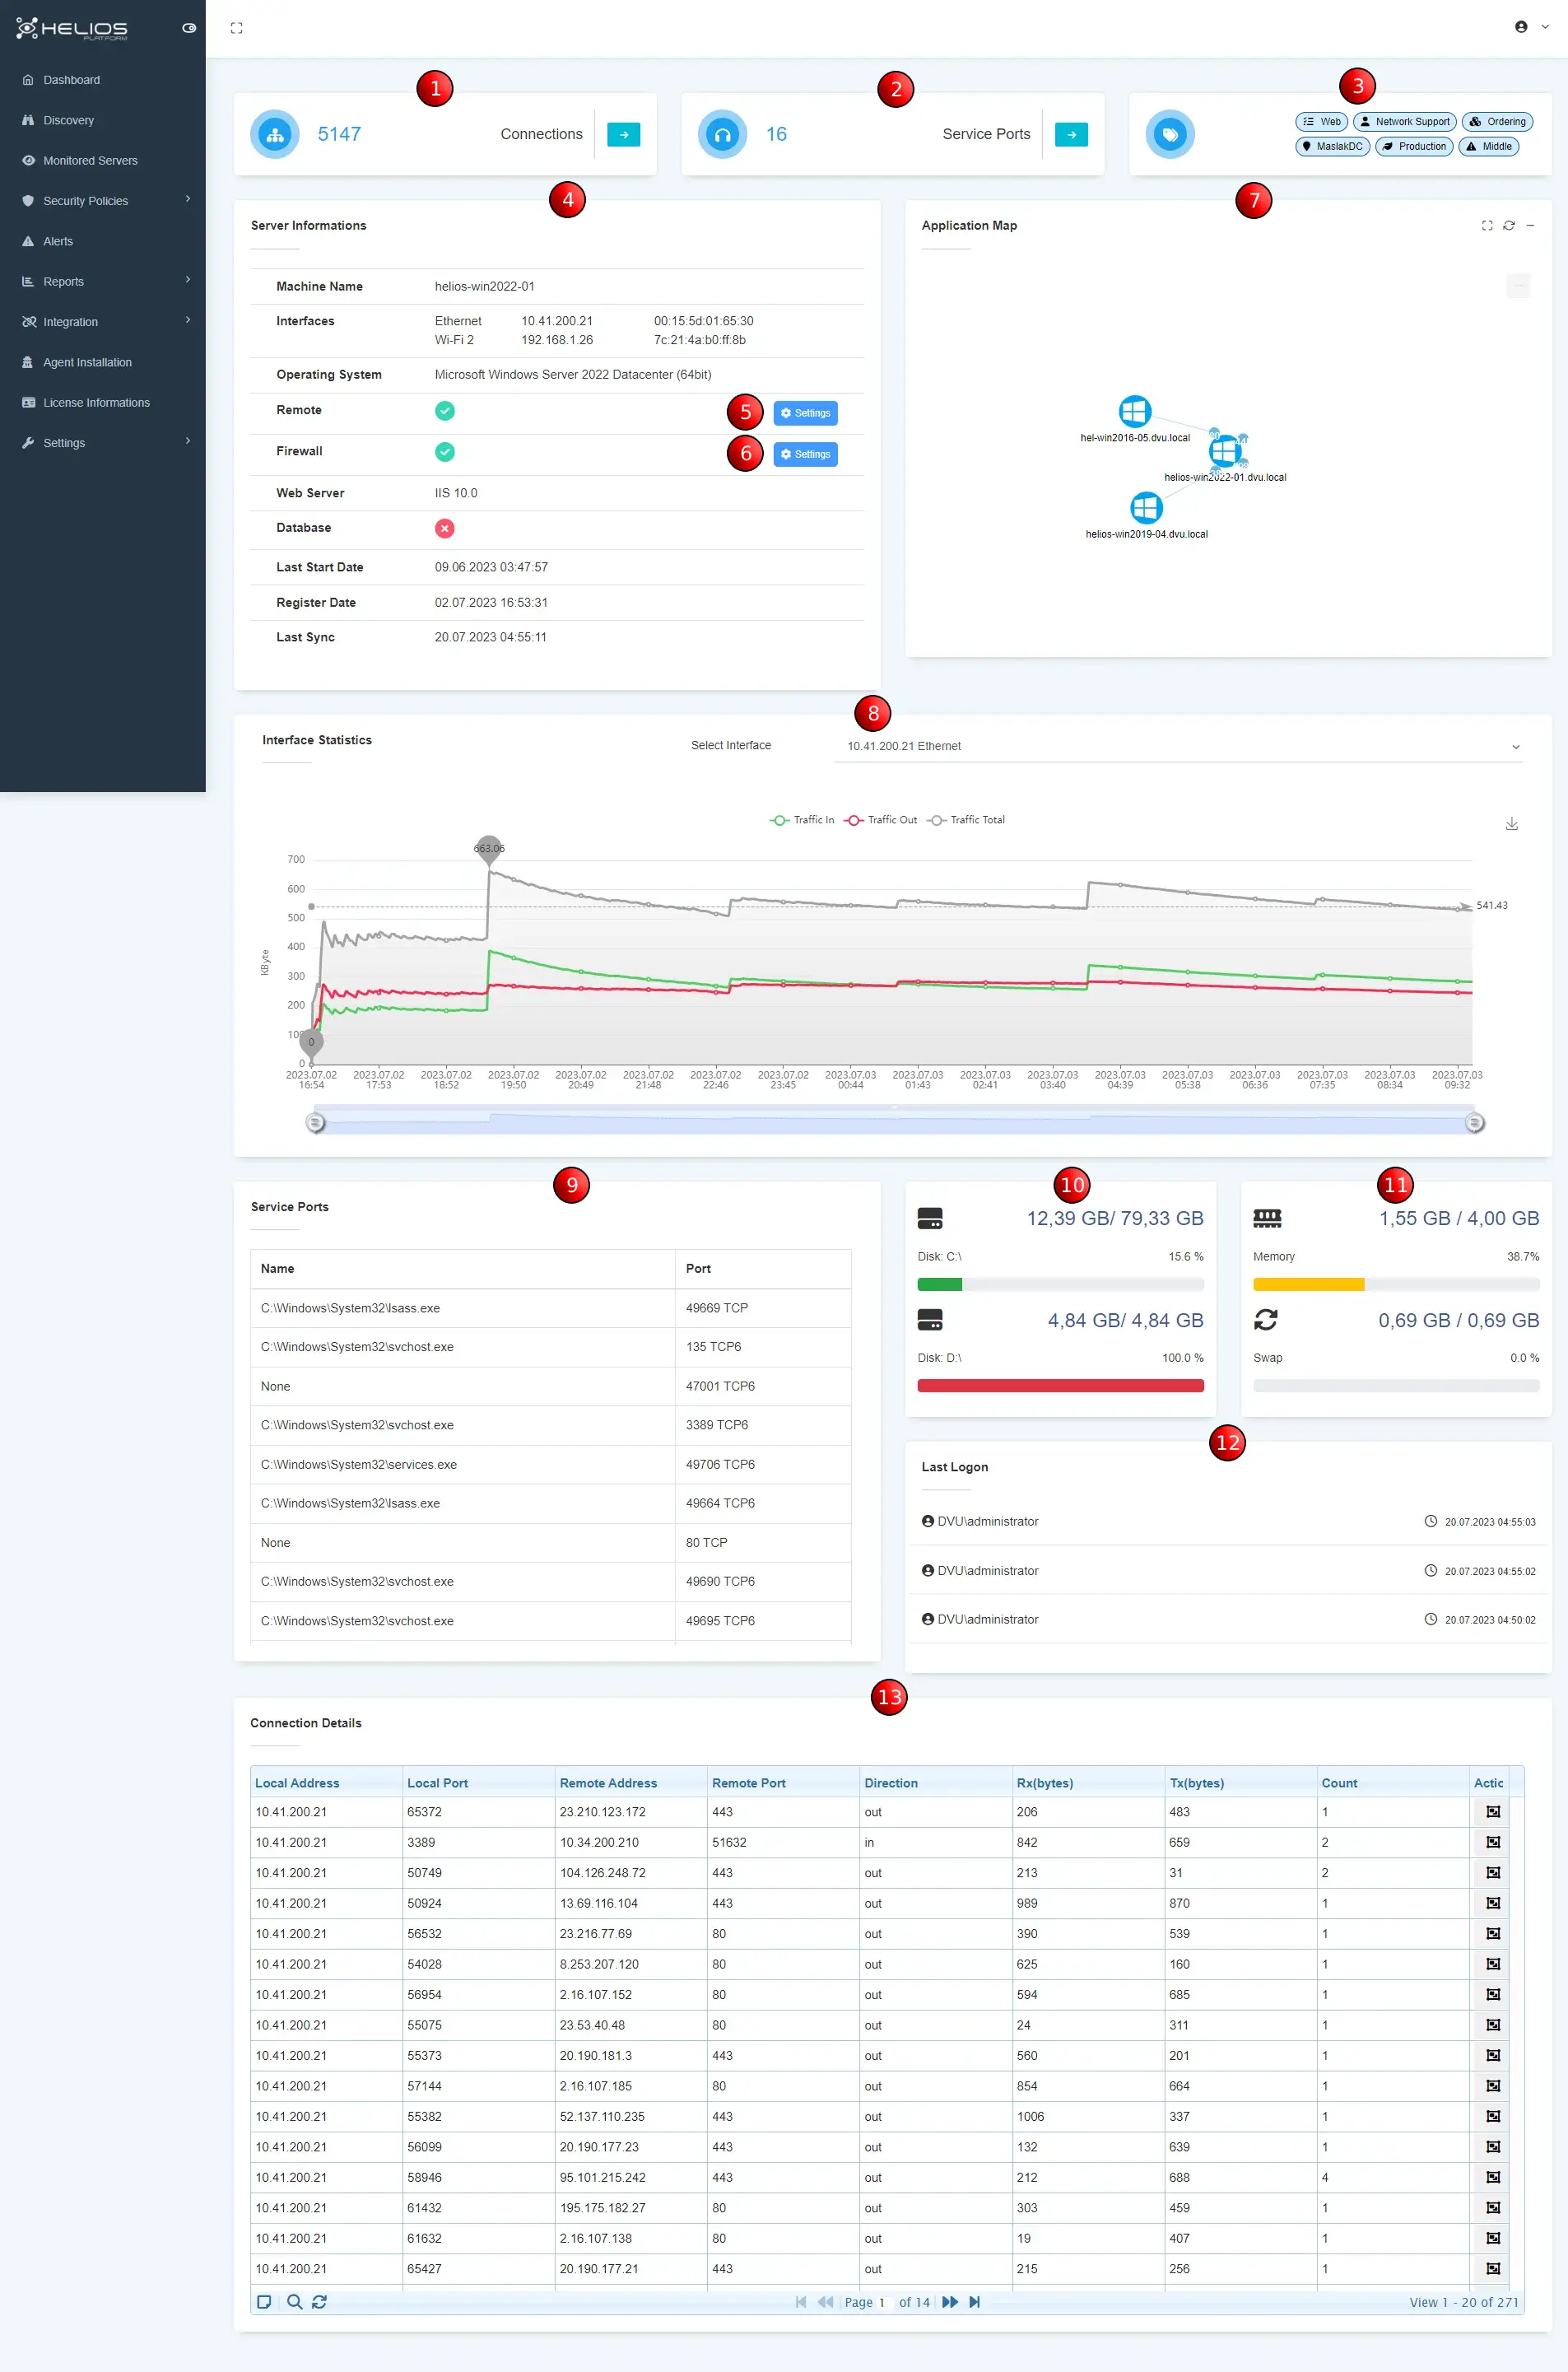
Note
All data sent by agents on the detail page are statistically displayed using special calculation formulas. These data are updated periodically.
- Total number of connections
- Number of active listening service ports.
- Labels assigned to the device.
- Information about the device.
- Remote connection settings (RDP, SSH).
- Local firewall settings.
- Application dependency map.
- Traffic information of physical/virtual interfaces on the device (displayed separately for each interface).
- Active listening service ports.
- Disk statistics on the device.
- Memory statistics on the device.
- Information of the last 3 users logged into the device.
- Incoming and outgoing connection details to the device.
Web Server Details
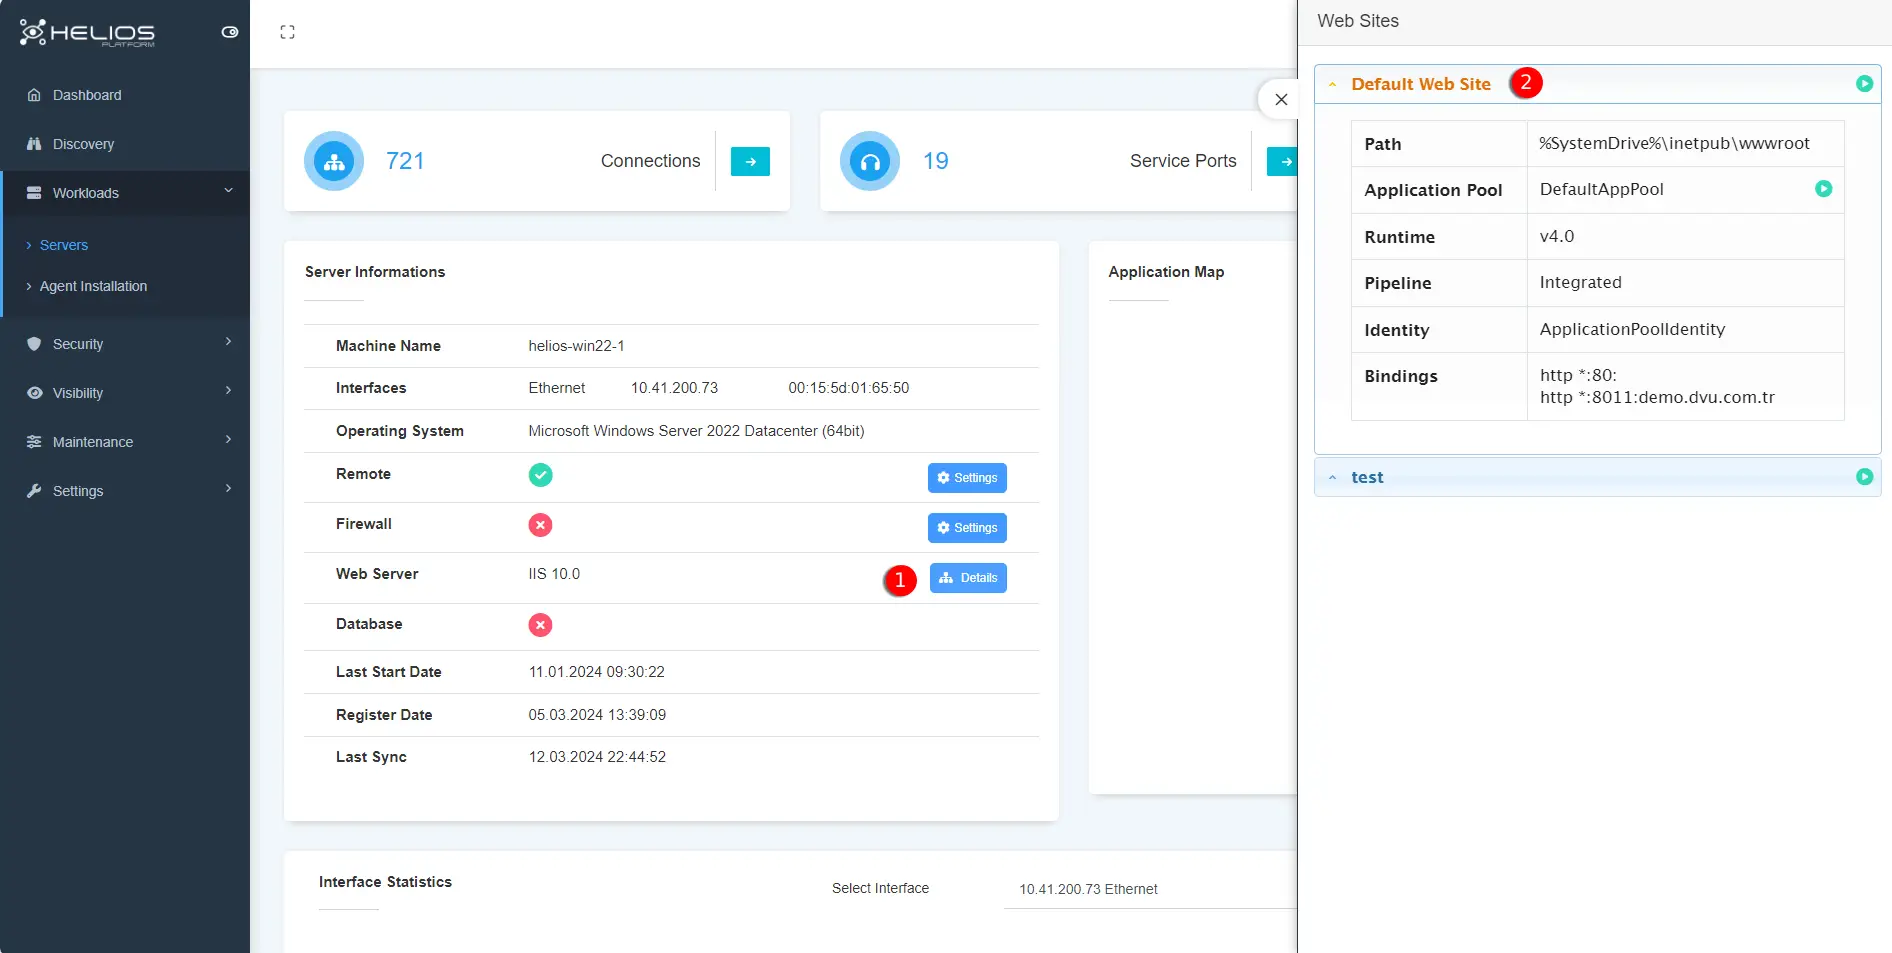
Note
The web servers (IIS, Apache) installed on the servers and the web applications hosted on them are automatically discovered.
- Click the button to see details about webserver.
- Details of the websites hosted on the webserver.
Security Policies
Note
The primary condition for a successful micro-segmentation project is the complete extraction of the right inventory.
Defining the relational networks of applications and processes of the inventoried inventory will be the secondary step. With this relational network, it should be aimed to reveal which applications and processes our inventory has, and how they communicate with different systems and different users.
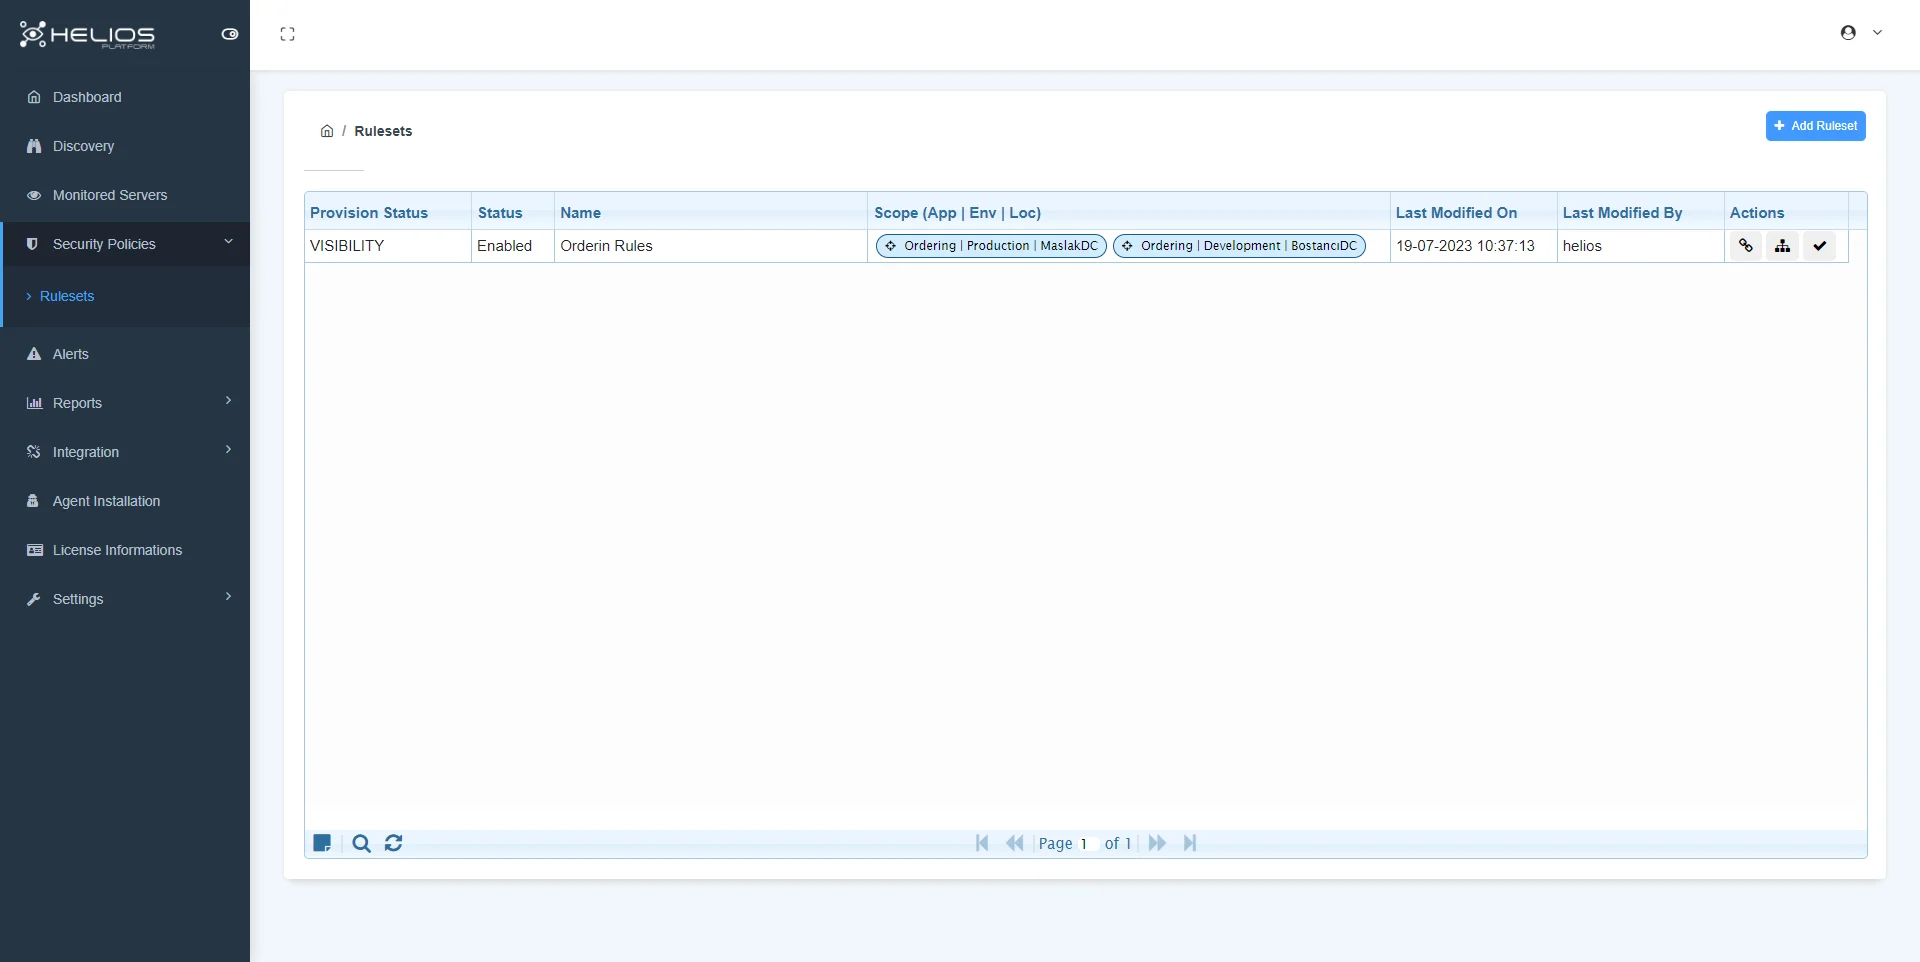
Create a Ruleset
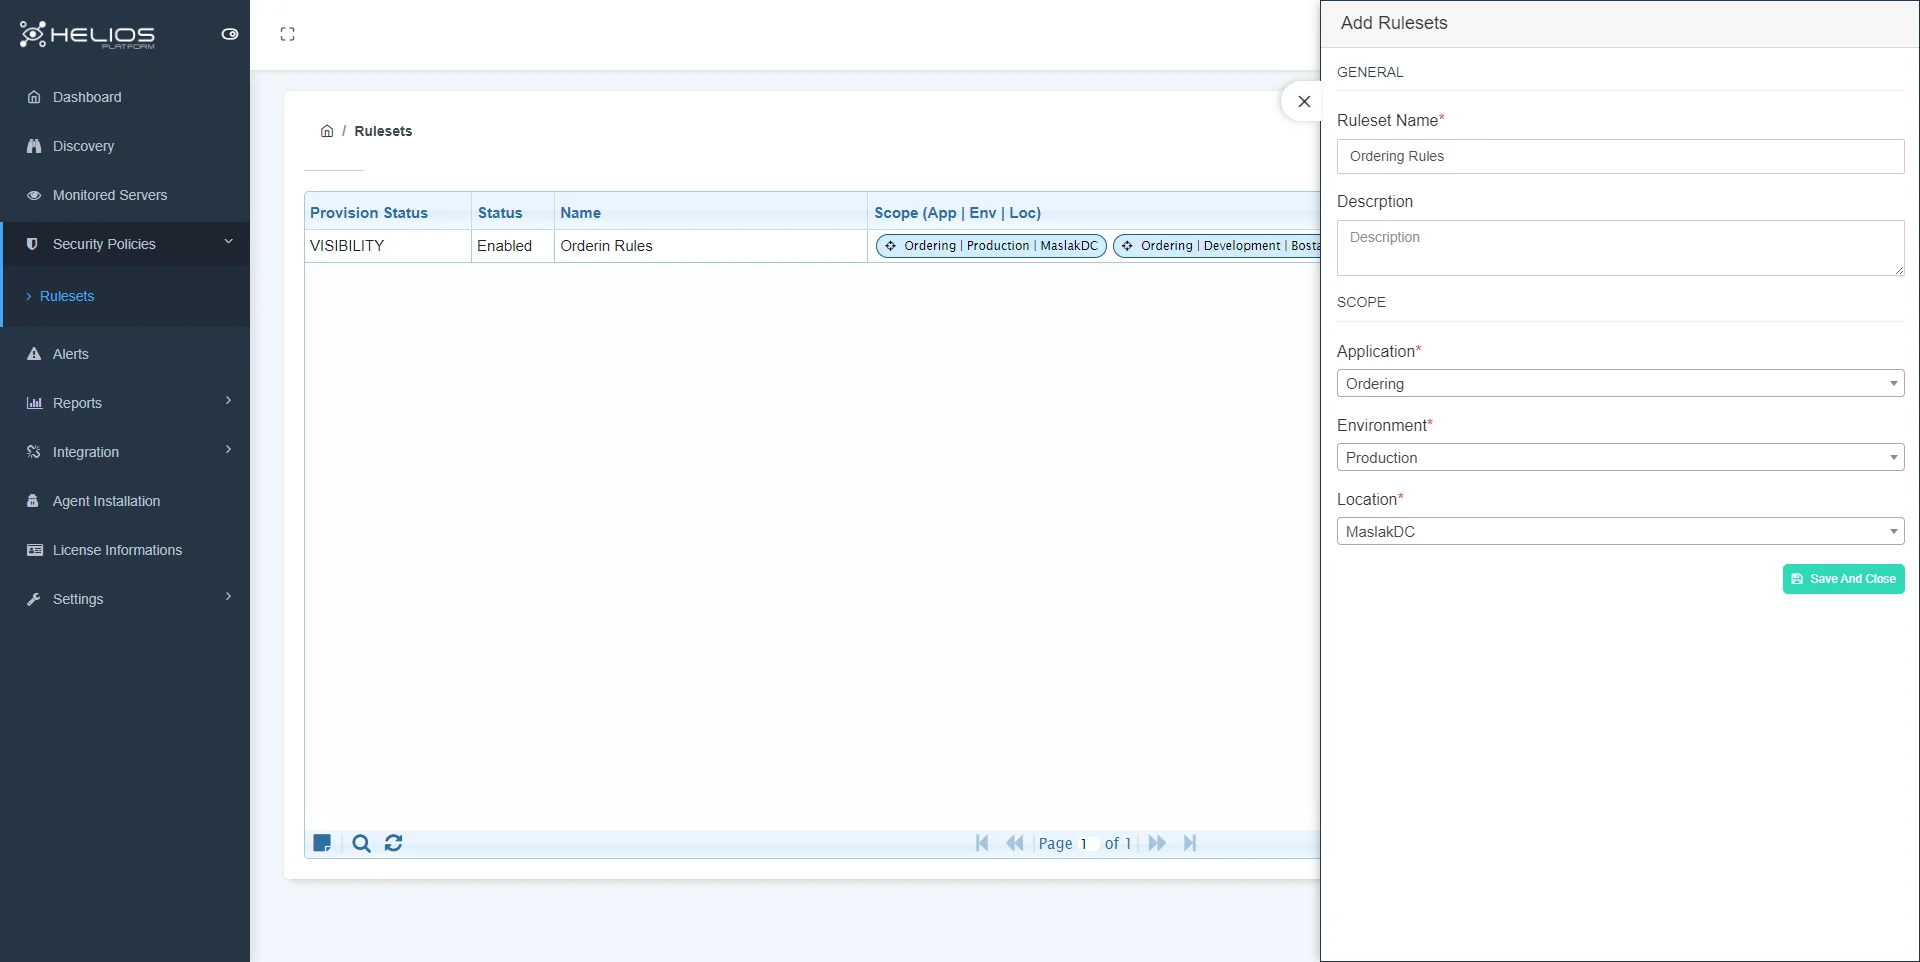
Click on the Rulesets link under Security Policies.
On this screen, we click on the add ruleset button and fill in the ruleset name and description fields in the window that opens, and then we determine the scope of our segment in the Scope section.
By selecting Application, Environment and Location, we group the servers in this scope by using the labels defined for the servers.
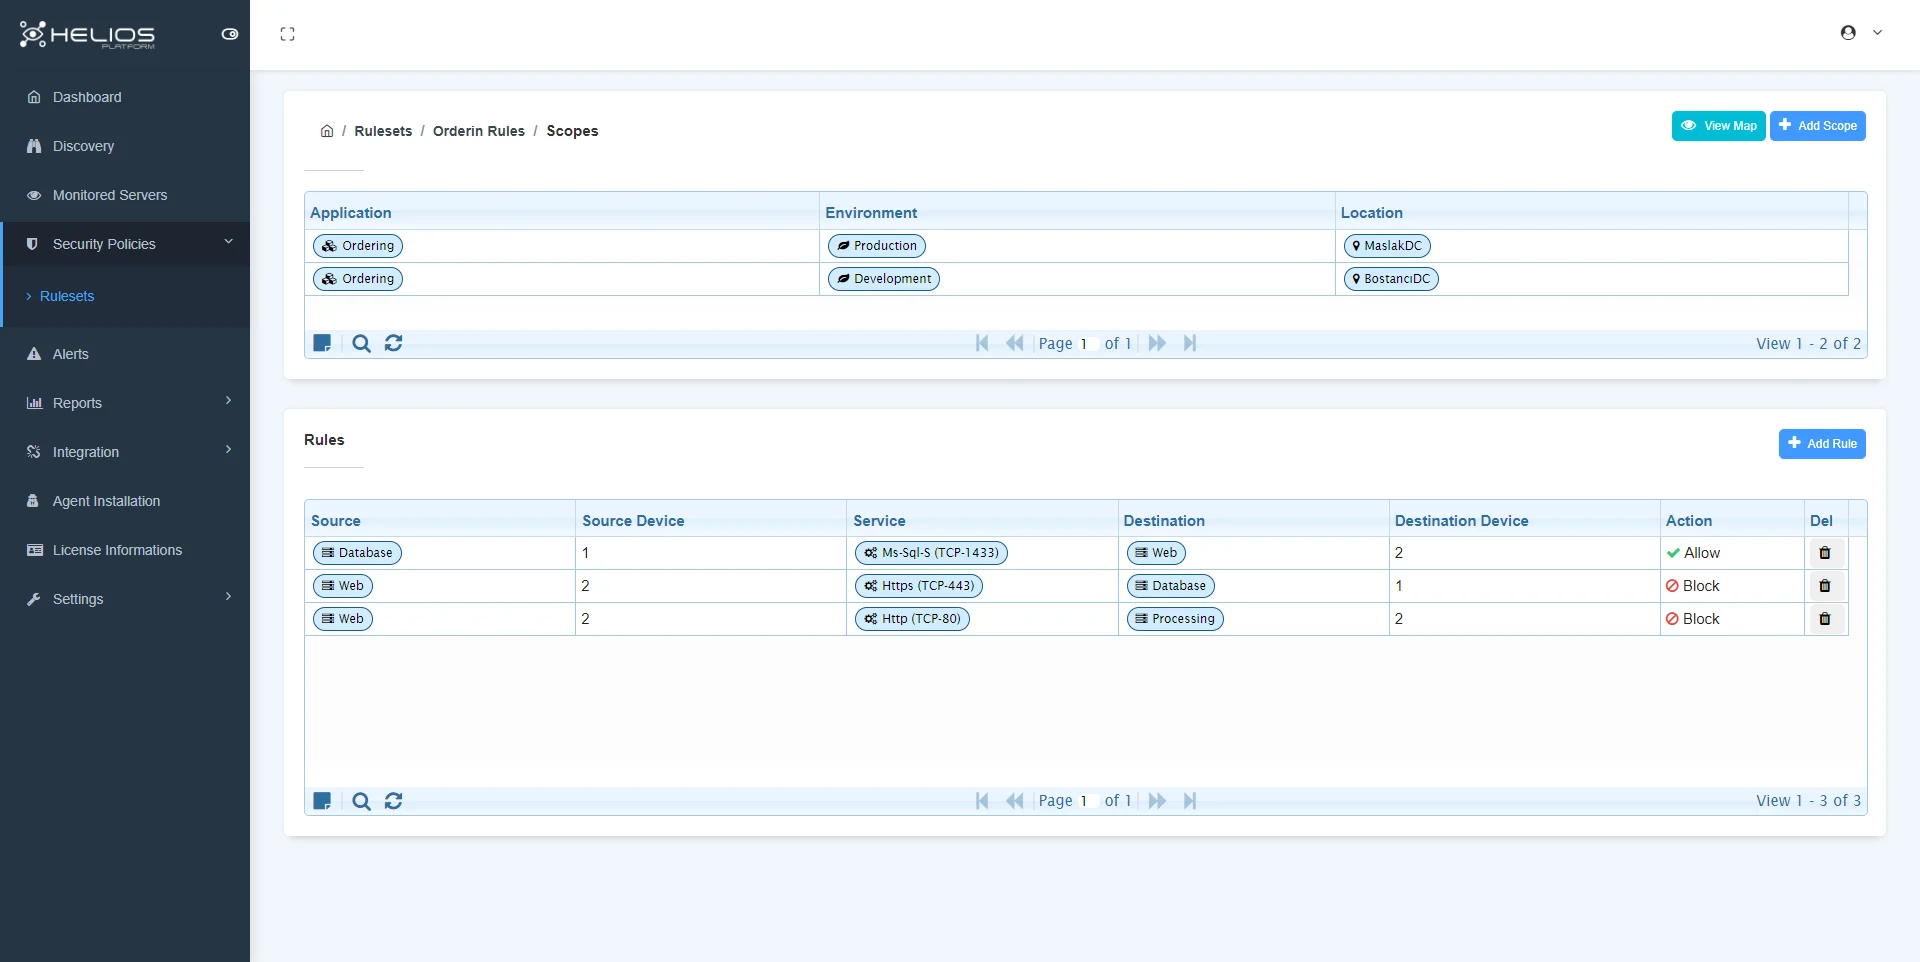
Create a Scope and Rule
To add scope and rule to the rule sets we created, we click on the second button under the action title in the rulesets list.
Note
We can add more than one scope and more than one rule to the rule sets we create.
By clicking the add scope button, you can add a new scope by filling and saving the relevant fields in the window that opens.
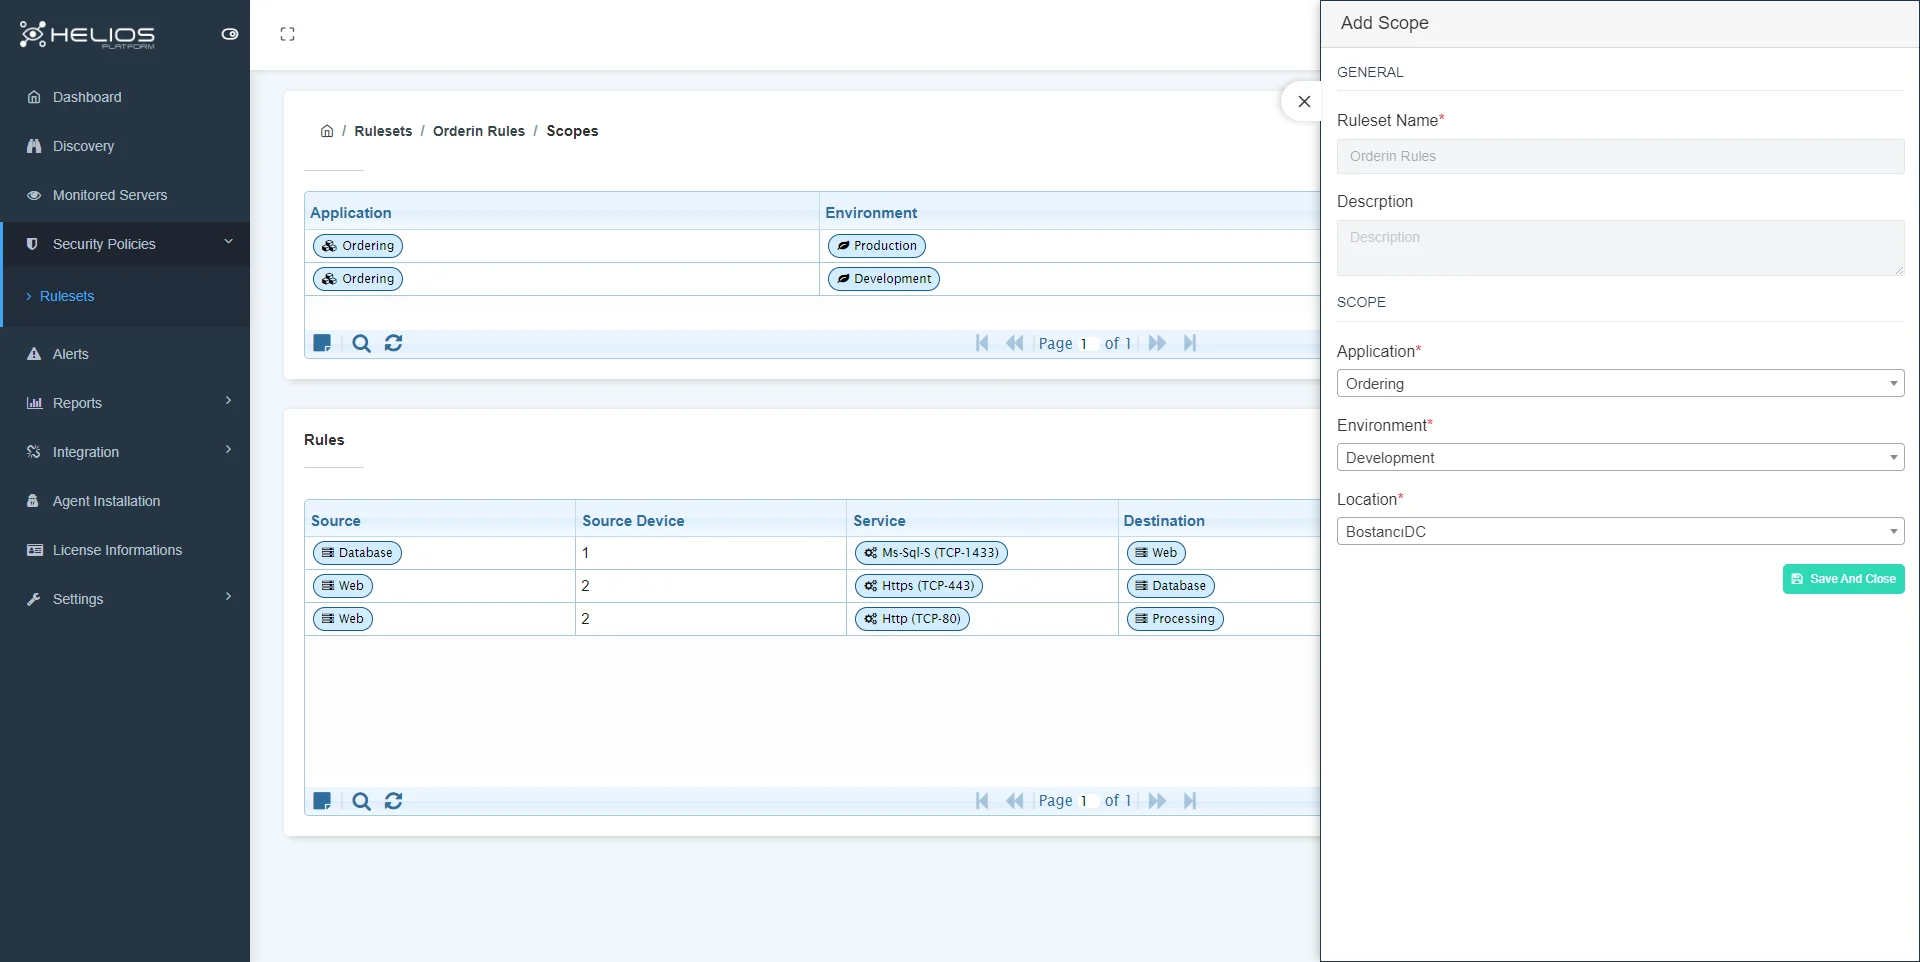
By clicking the add rule button, you can add a new rule by filling and saving the relevant fields in the window that opens.

Warning
- Source: The server role to which the Source rule will be applied.
- Service: the service port to be processed.
- Destination: server role to allow or block.
- Action: allow/block
Segmentation Map
We can view the scopes we define on the map, the servers included in the scopes, and the rules defined between these servers.
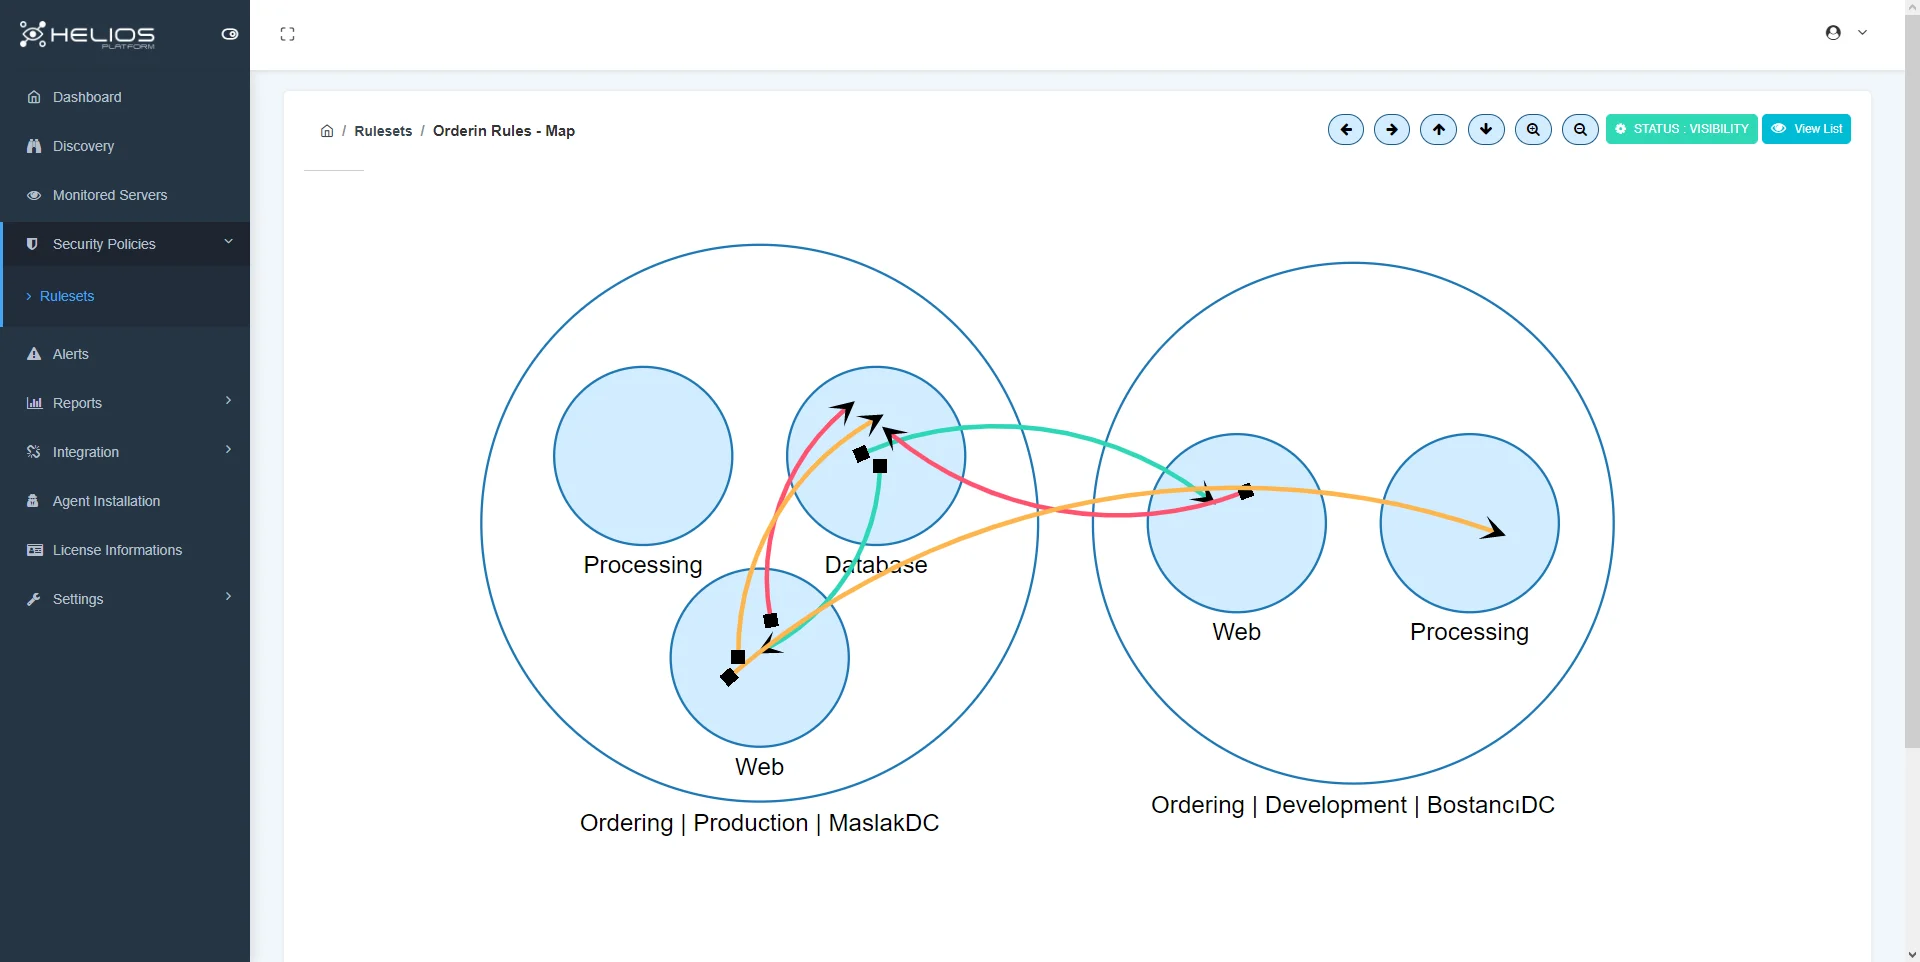
There are 3 provisioning states that we can apply to a ruleset.
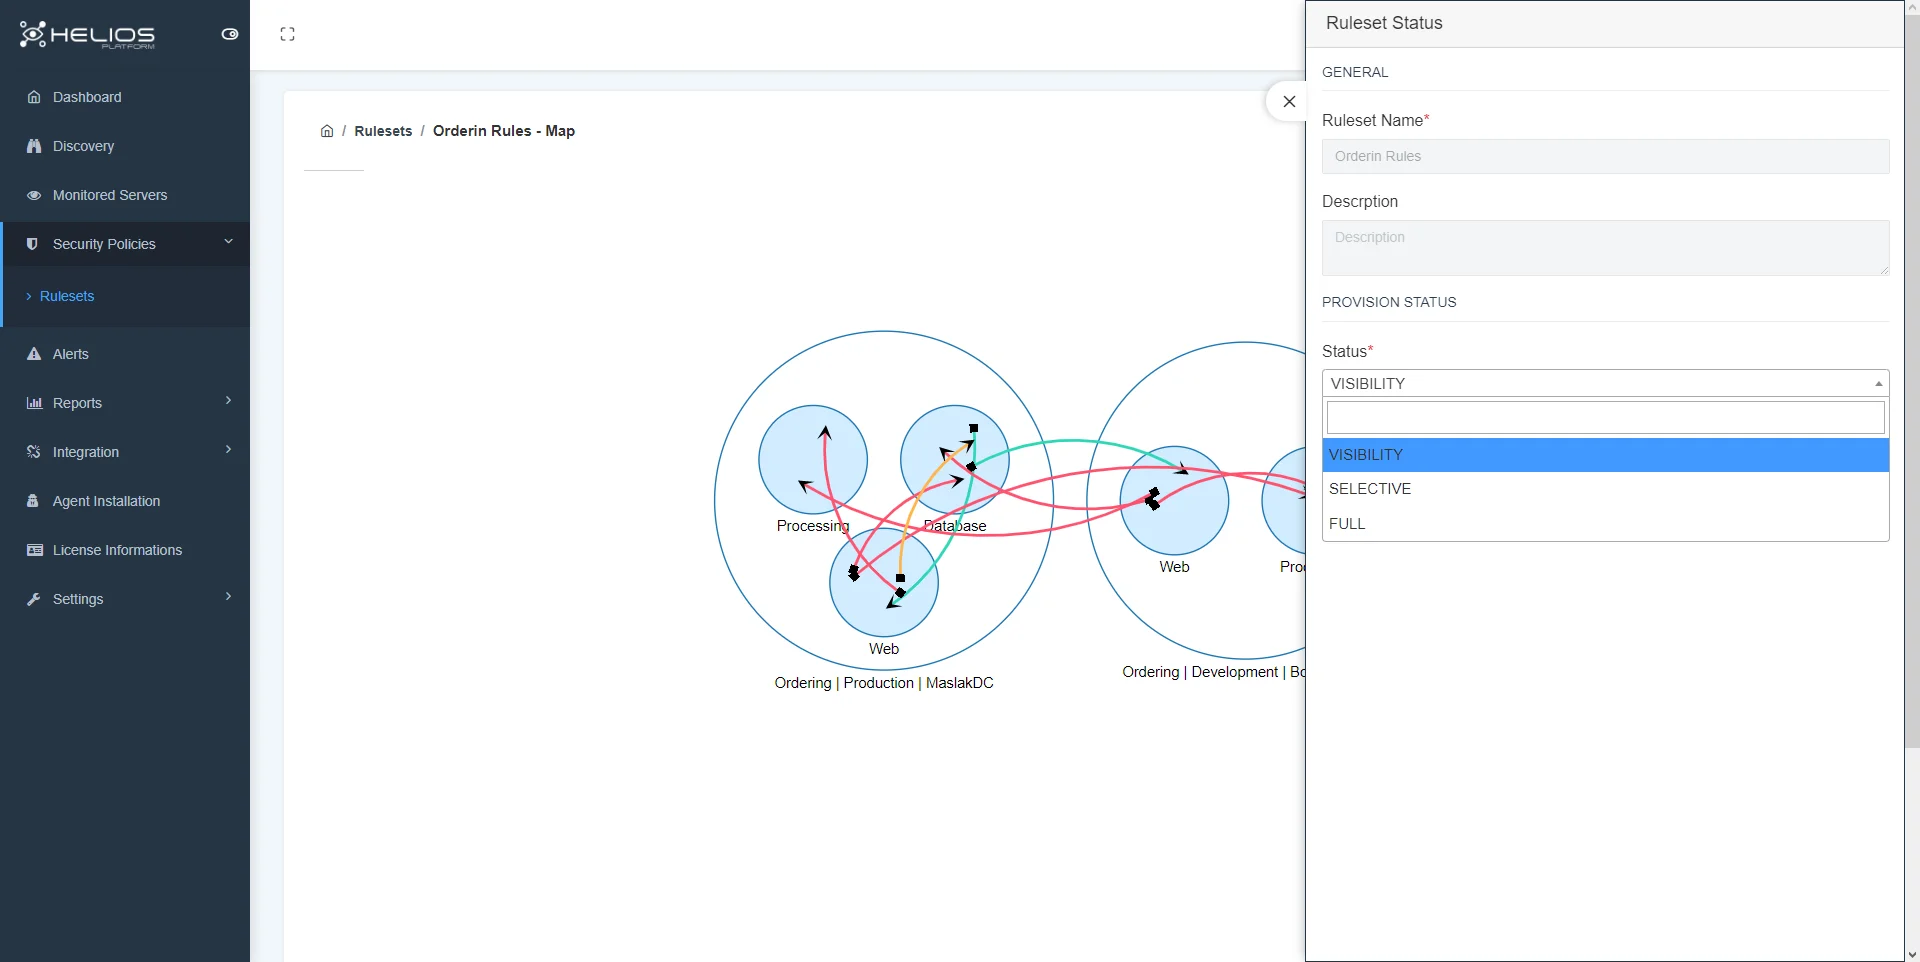
Note
- Visibility: The defined rules are not applied to the servers, only the defined rules and connections outside these rules are monitored.
- Selective: Defined rules are applied to servers and connections outside the defined rules are monitored.
- Full: Defined rules are applied to servers and connections outside the defined rules are automatically blocked.
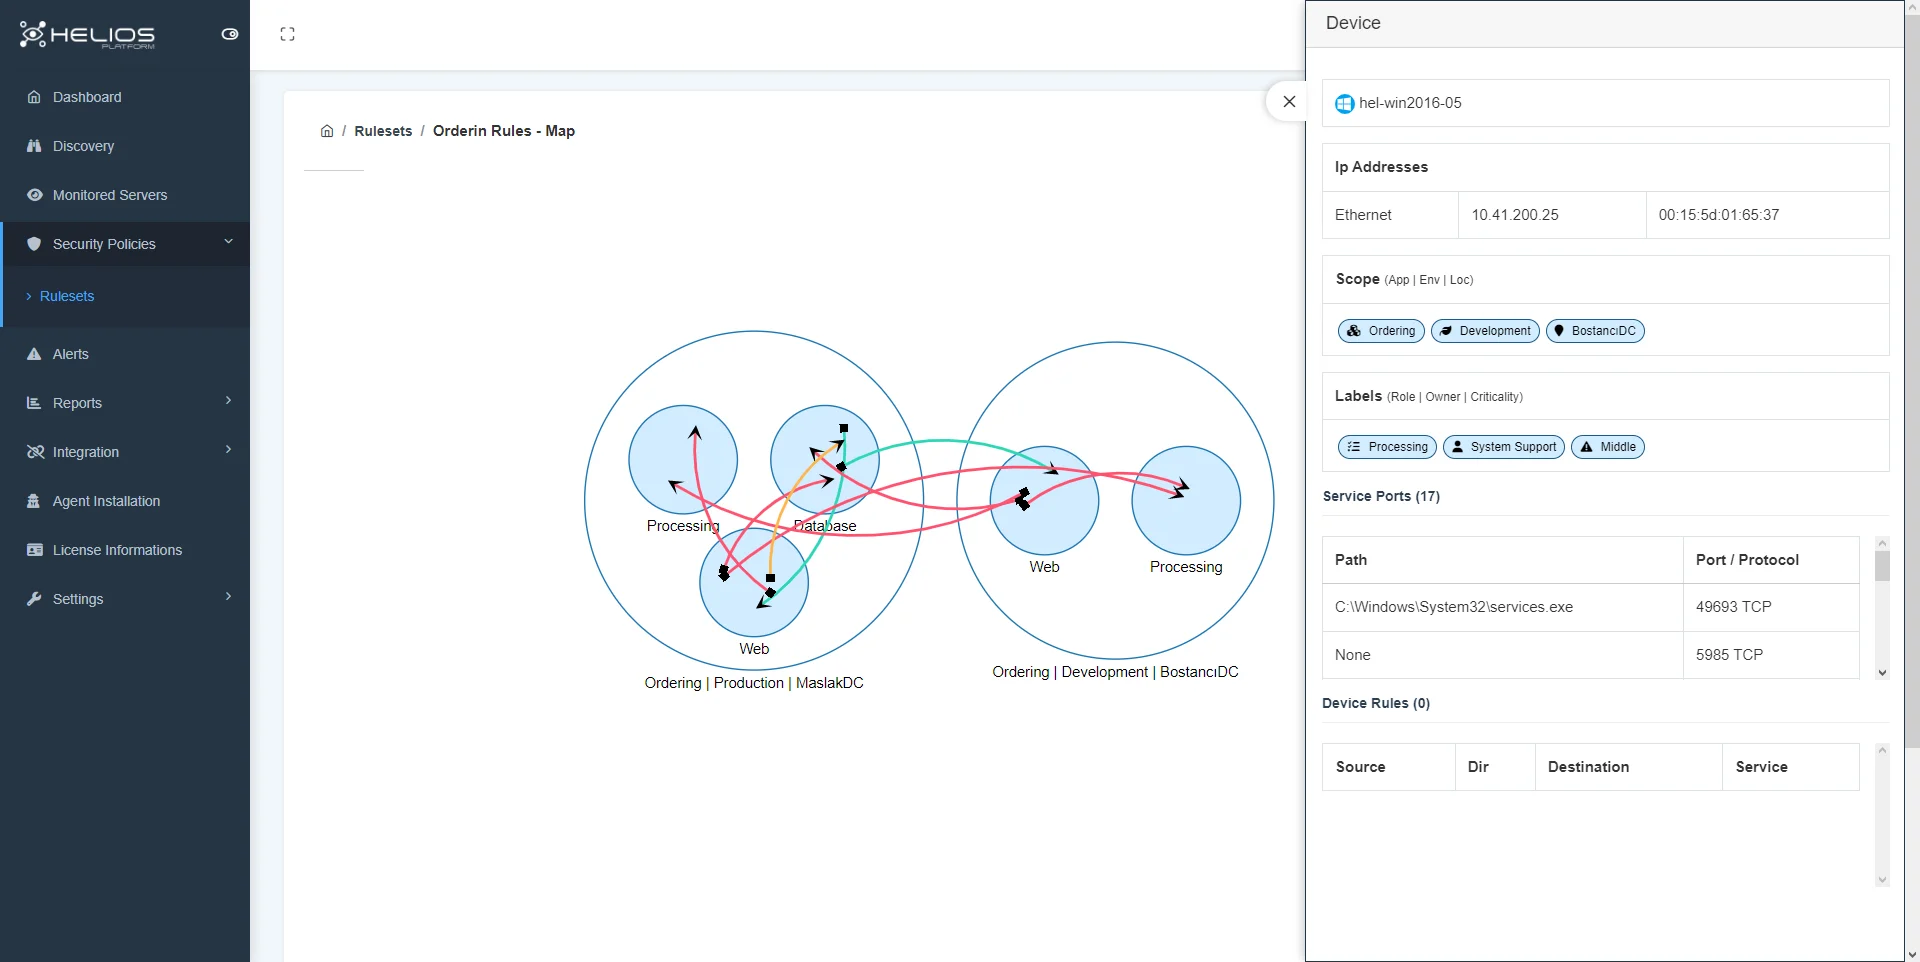
The circles on the map represent the servers and the arrows represent the rules.
Arrows use 3 different colors;
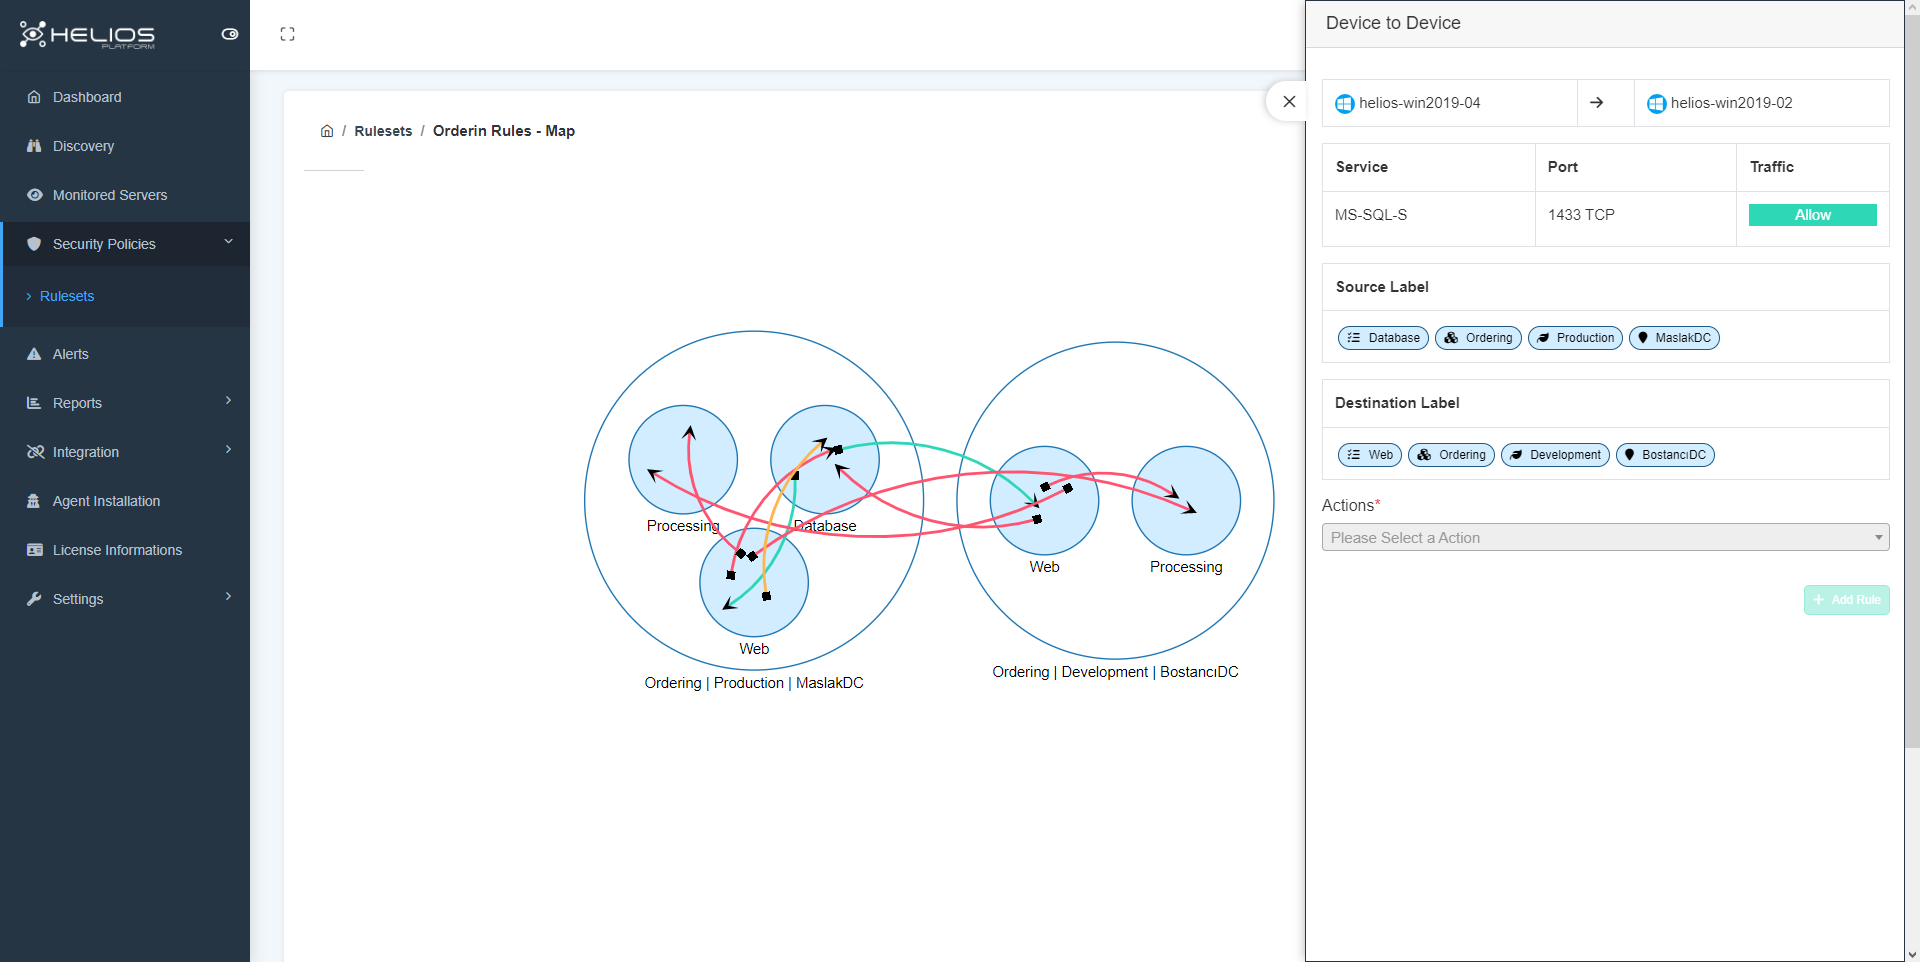
- Green : allowed connections
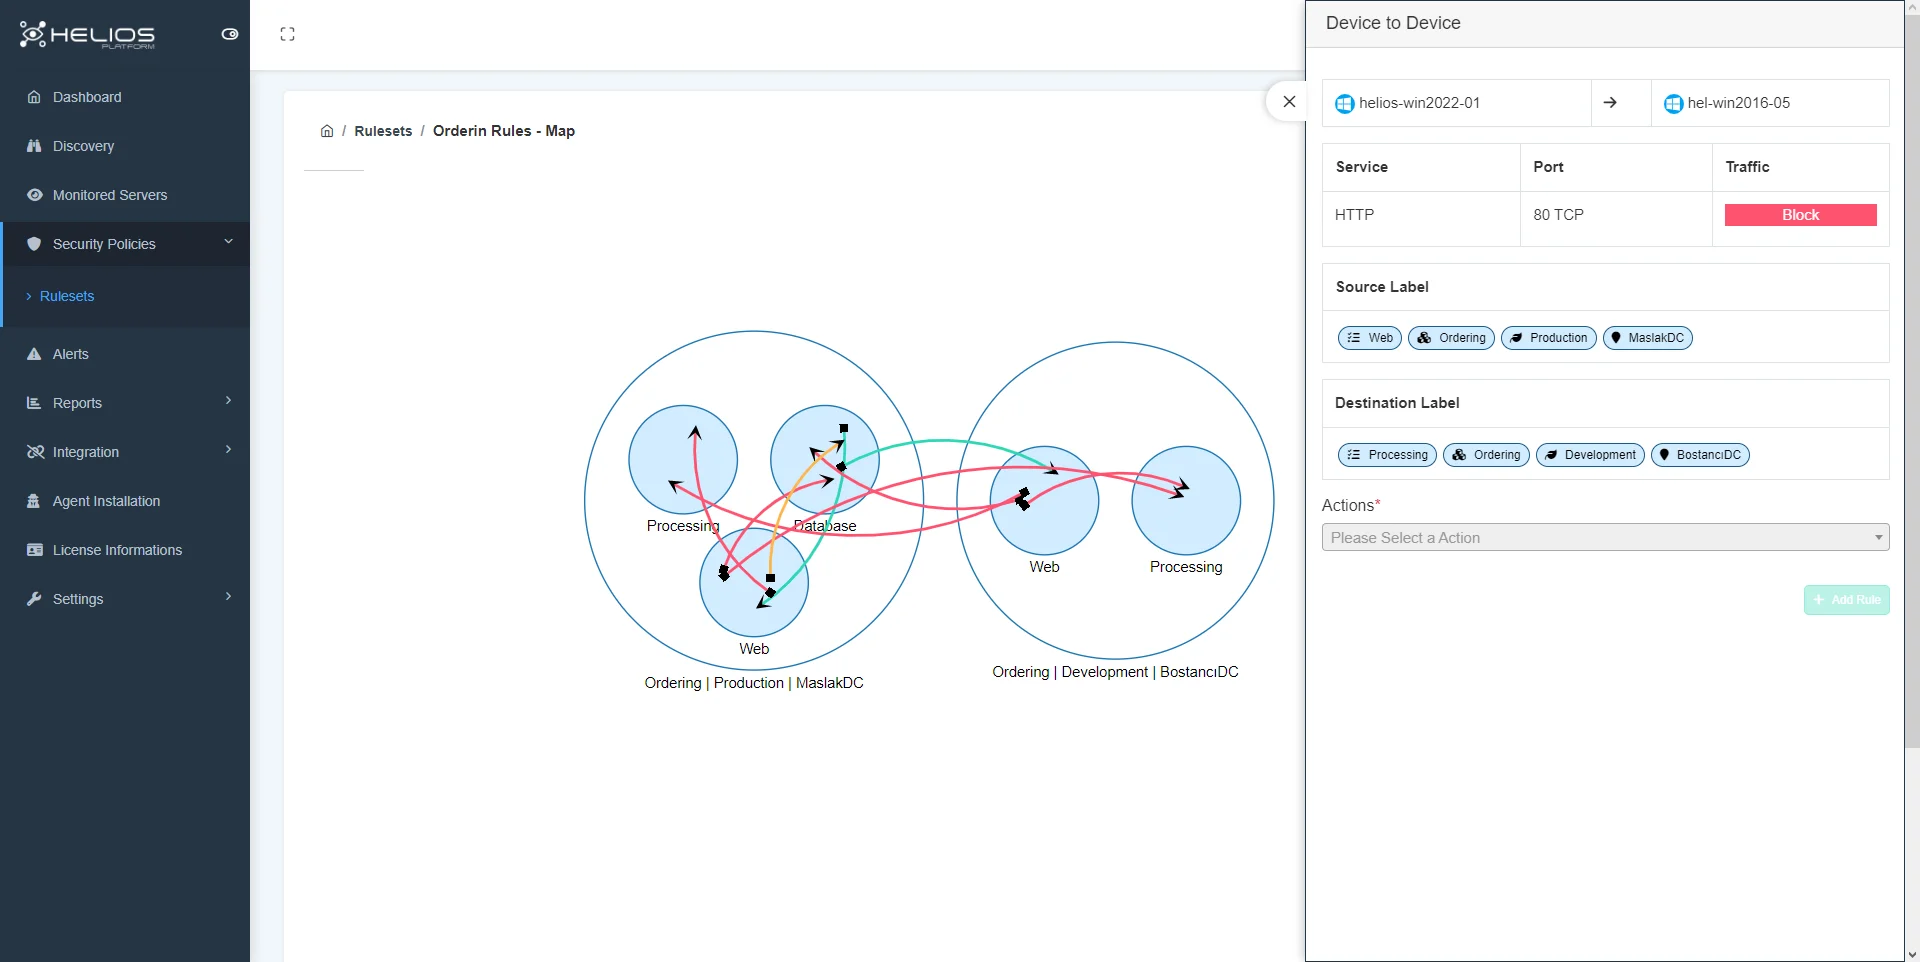
- Red: blocked connections
- Orange: means the rule is not defined but you can define Allow/Block rule by clicking on it.
Note
- When you click on the circle, the window that opens contains information about the presentation.
- When you click on the green arrow, the source, desteination and service port information of the allowed connection is displayed.
- When you click on the red arrow, the source, desteination and service port information of the blocked connection are displayed.
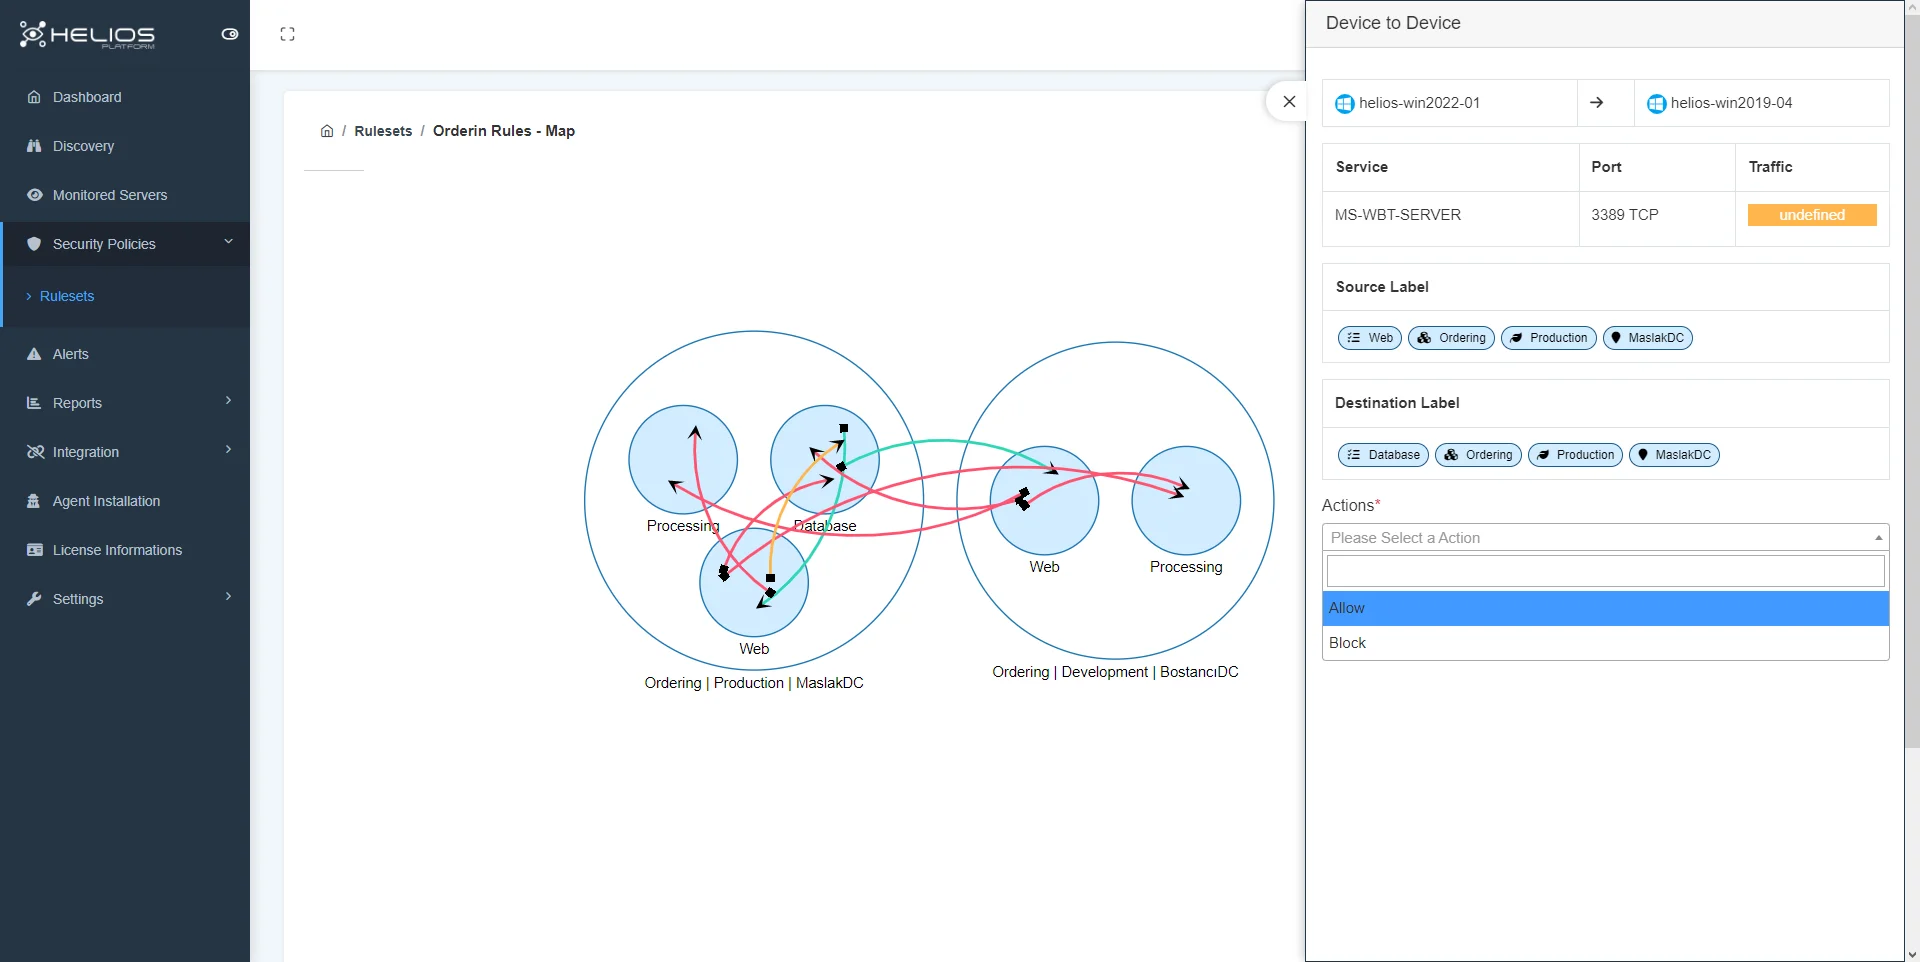
- When you click on the orange arrow, the source, desteination and service port information of the connection for which the rule is not defined will be displayed and you can create an allow/block rule for this connection.
Clicking on the circle (server) displays the following screen:
Clicking on the allowed (green arrow) connector displays the following screen:
Clicking on the blocked (red arrow) connector displays the following screen:
Clicking on the undefined (orange arrow) connector displays the following screen:
Alerts
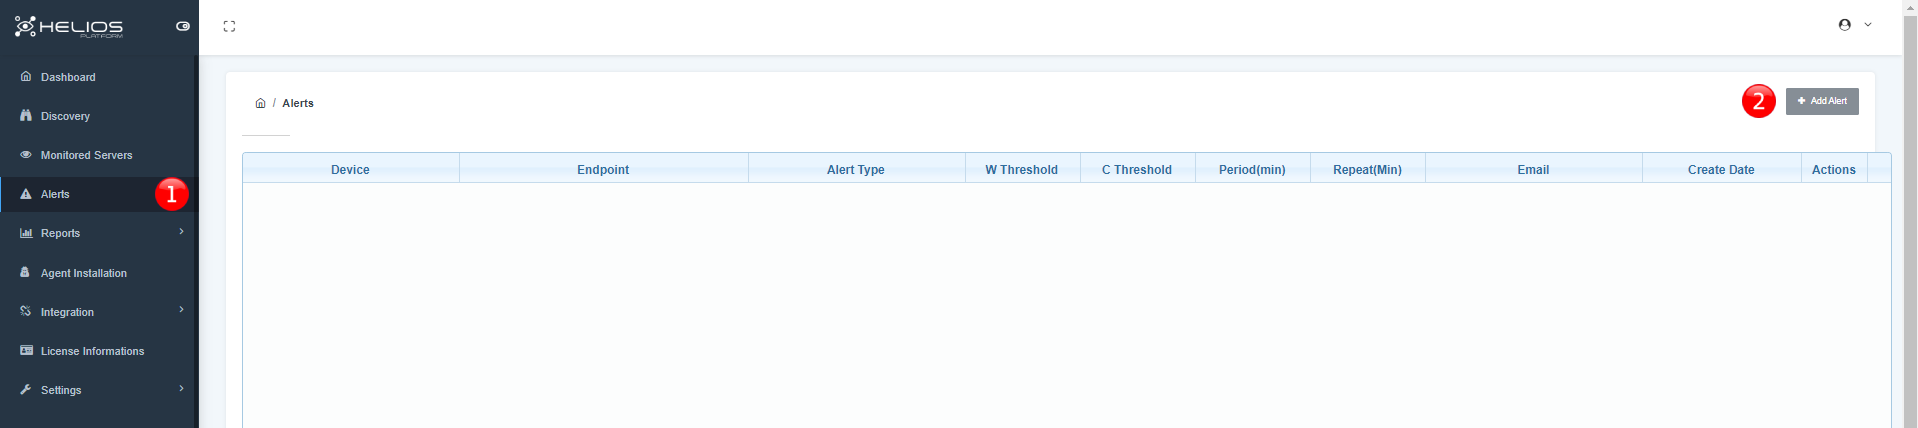
- Click to pass alerts section.
- Click to add alert.
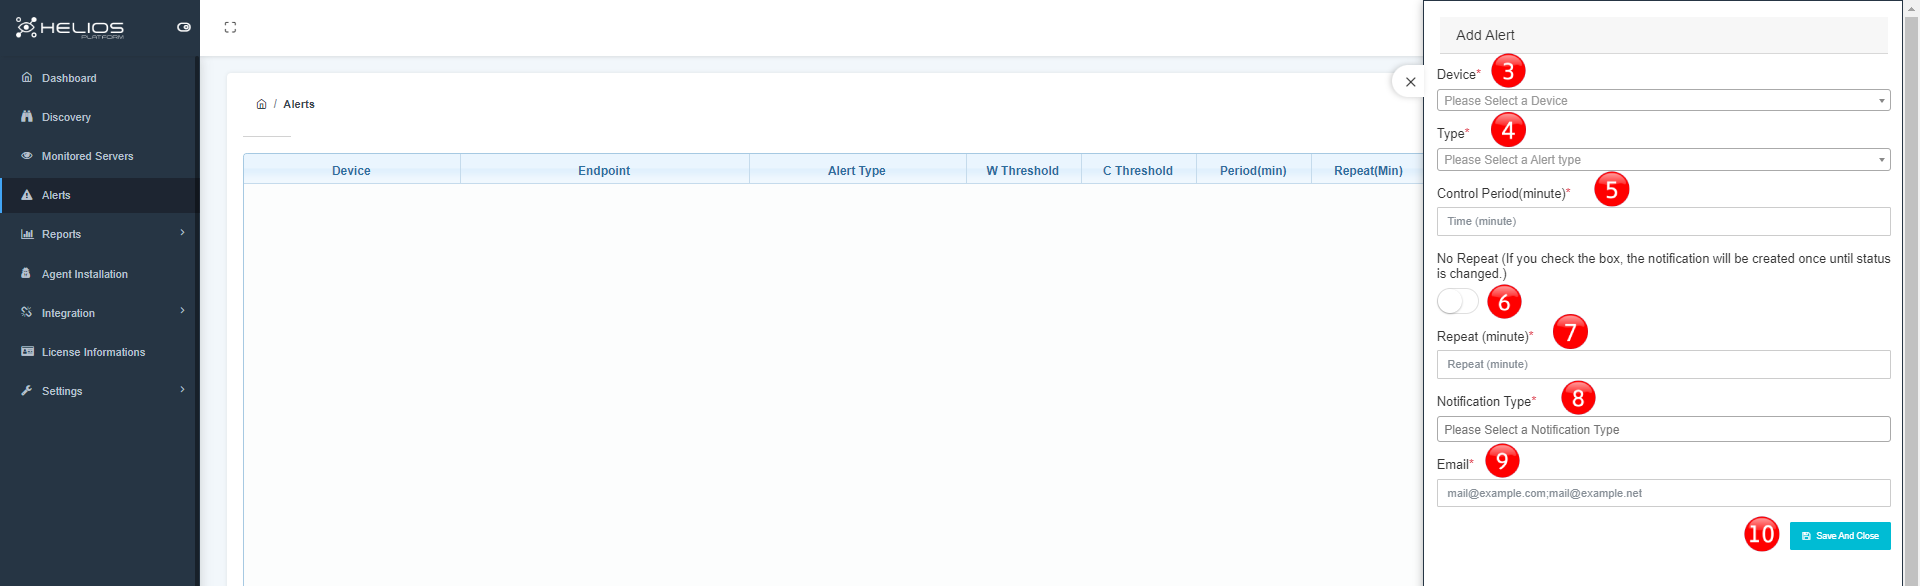
- Select device.
- Select alert type.
- Select alert period.
- Activate button if you don’t want alert period.
- Set repeat period.
- Select notification type.
- Enter the e-mail address.
- Save and close.
Reports
Server Map
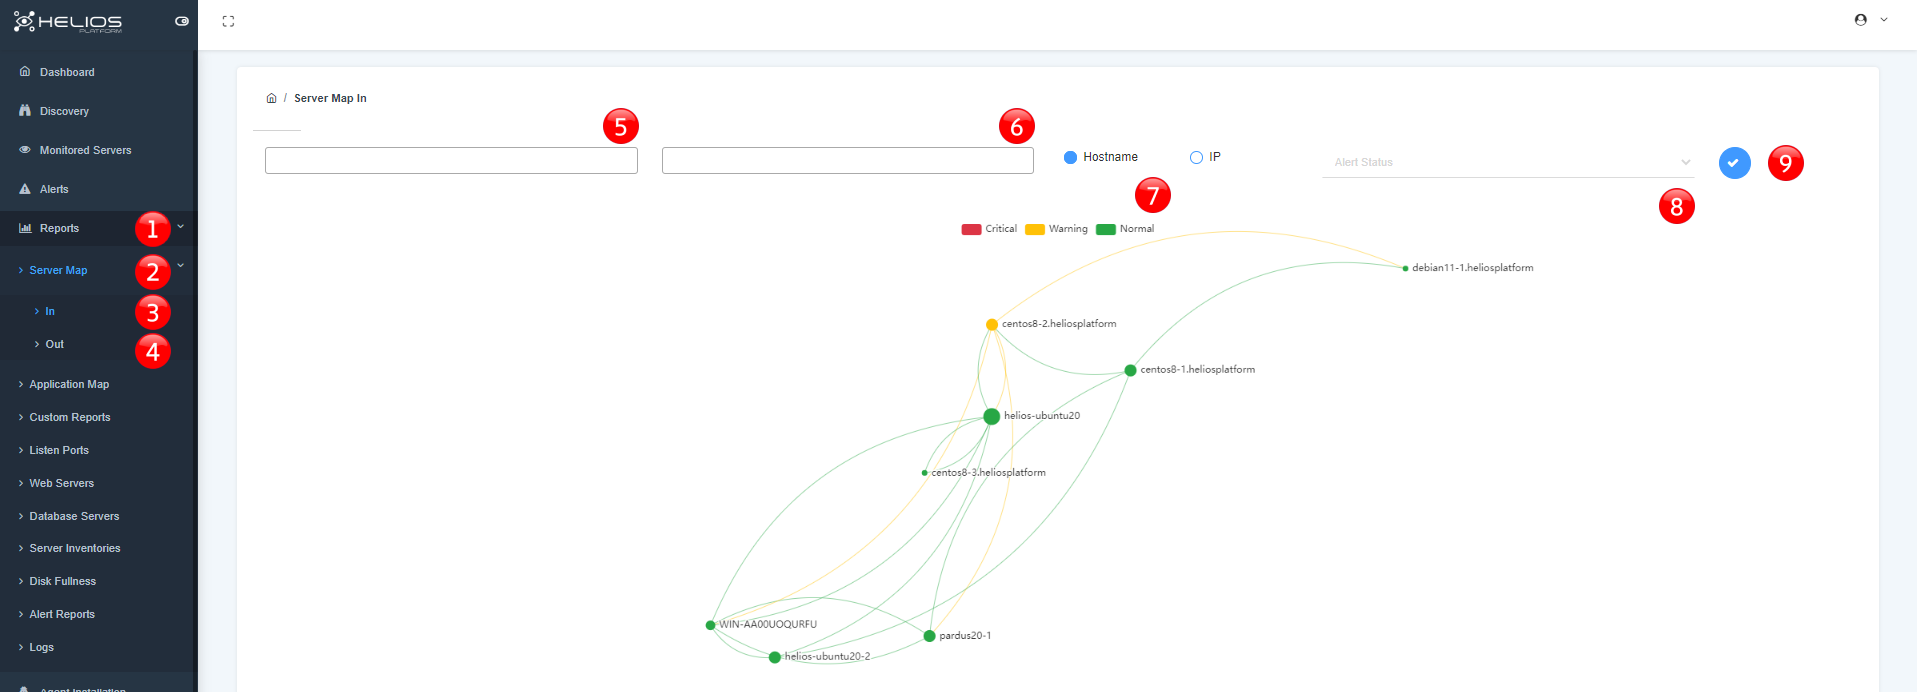
- Click to pass reports section.
- Click to see server map options, in/out.
- Click to see server map option in.
- Click to see server map option out.
- Enter hostname to monitor by specific hostname.
- Enter IP address to monitor by specific IP address.
- Choose the option to monitor by hostname or IP address.
- Select alert status/ operating system.
- Click to see result.
Application Map
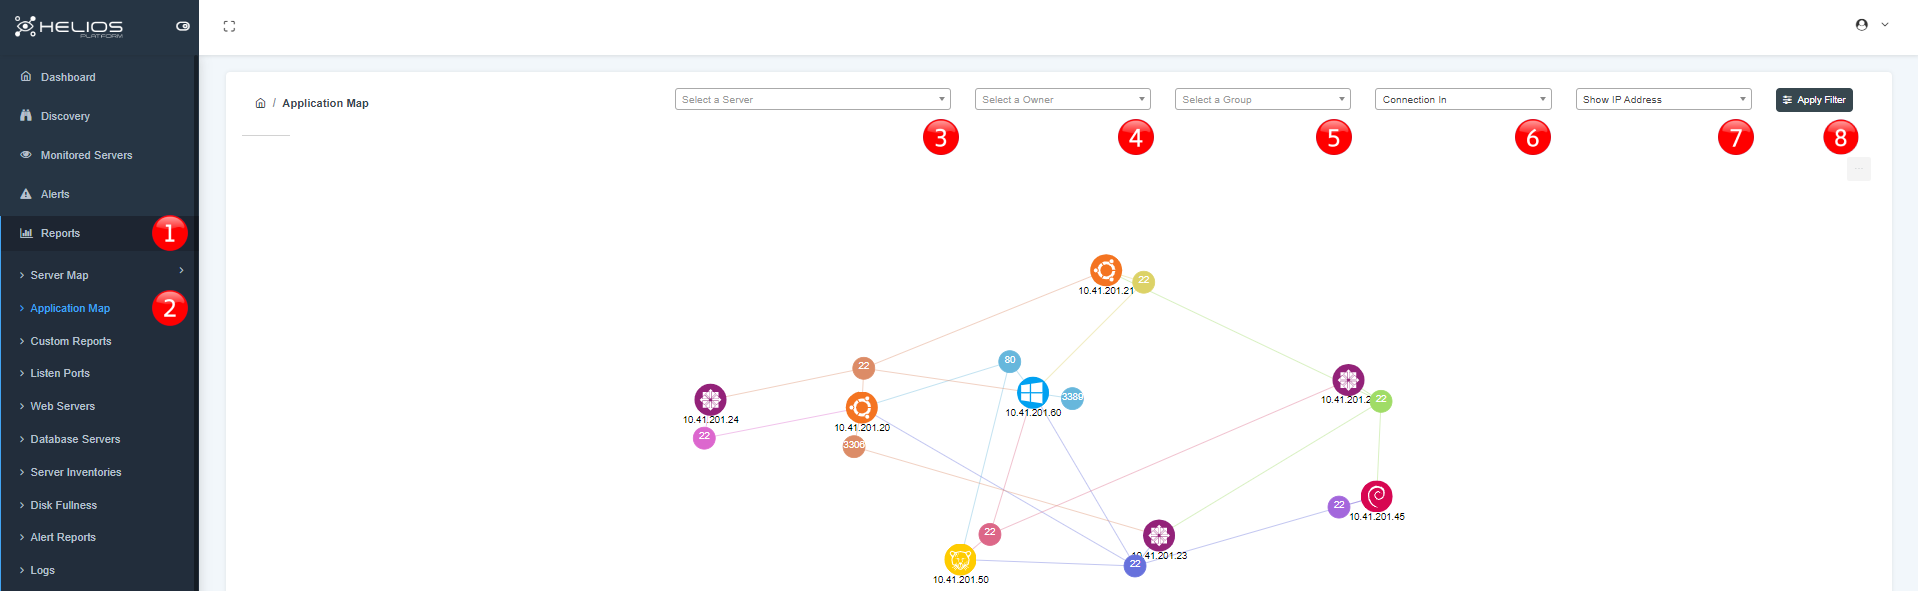
- Click to pass reports section.
- Click to see application map.
- Select a server from dropdown menu represented by the number 3.
- Select an owner from dropdown menu represented by the number 4.
- Select a group from dropdown menu represented by the number 5.
- Select a connection tip from dropdown menu represented by the number 6.
- Select a show IP address/Hostname represented by the number 7.
- Click to apply filter to see result.
Custom Reports
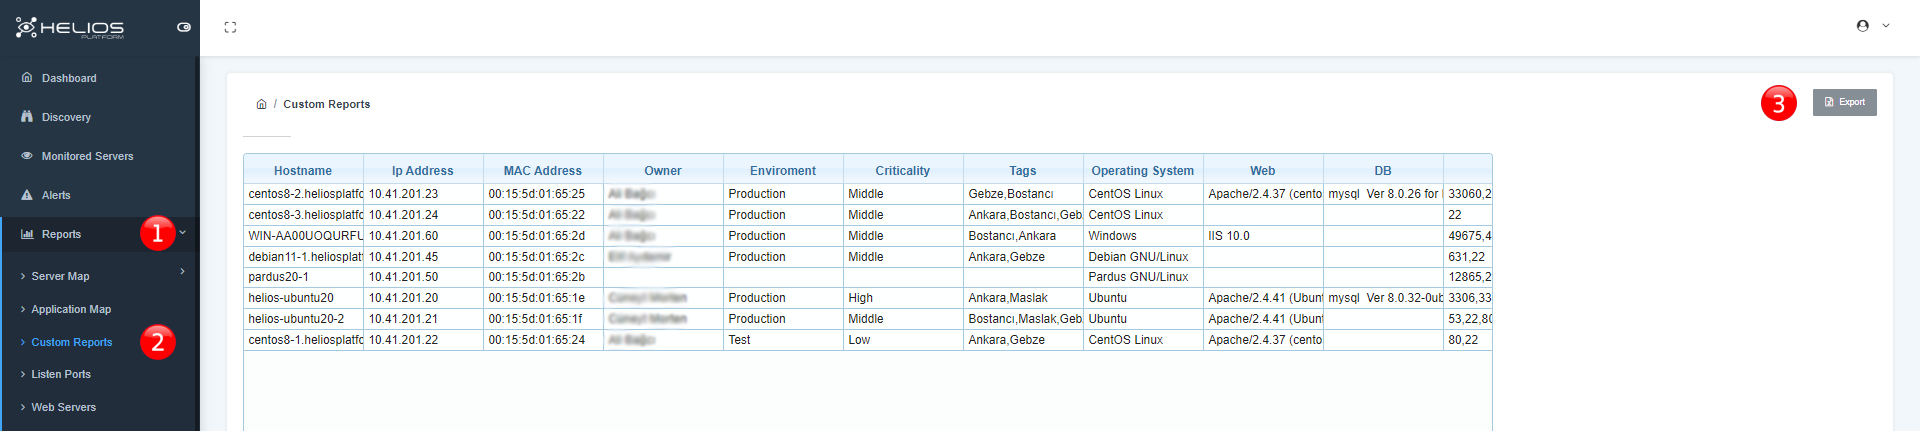
- Click to pass reports section.
- Click to custom reports.
- Click to export custom reports as excel format.
Listen Ports
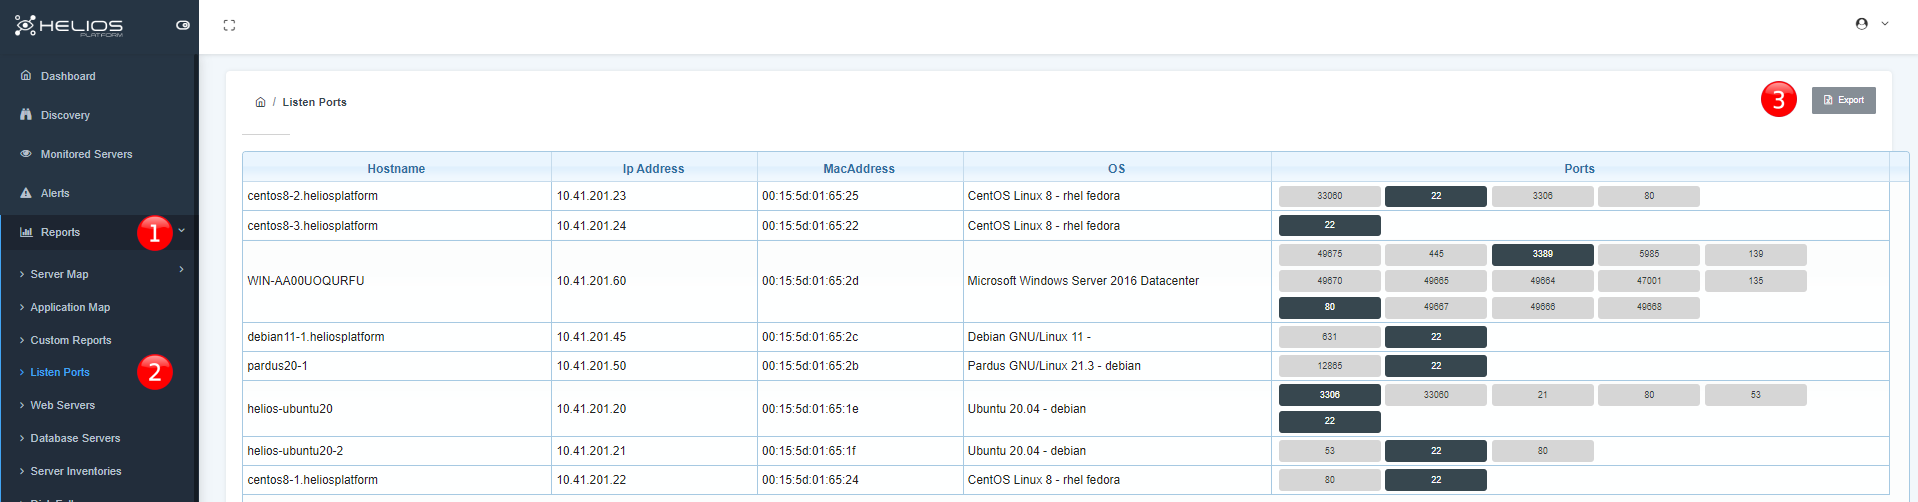
- Click to pass reports section.
- Click to listen ports.
- Click to export listen ports as excel format.
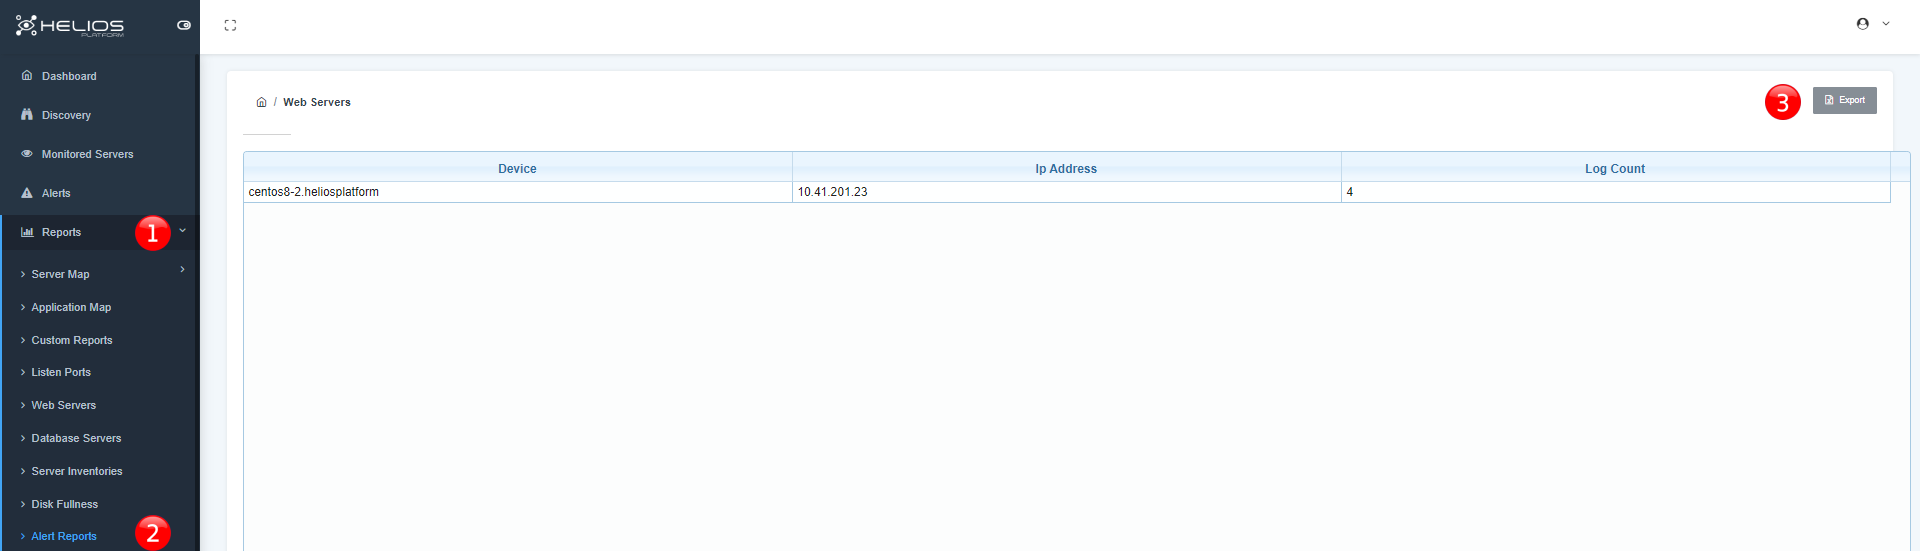
Web Servers
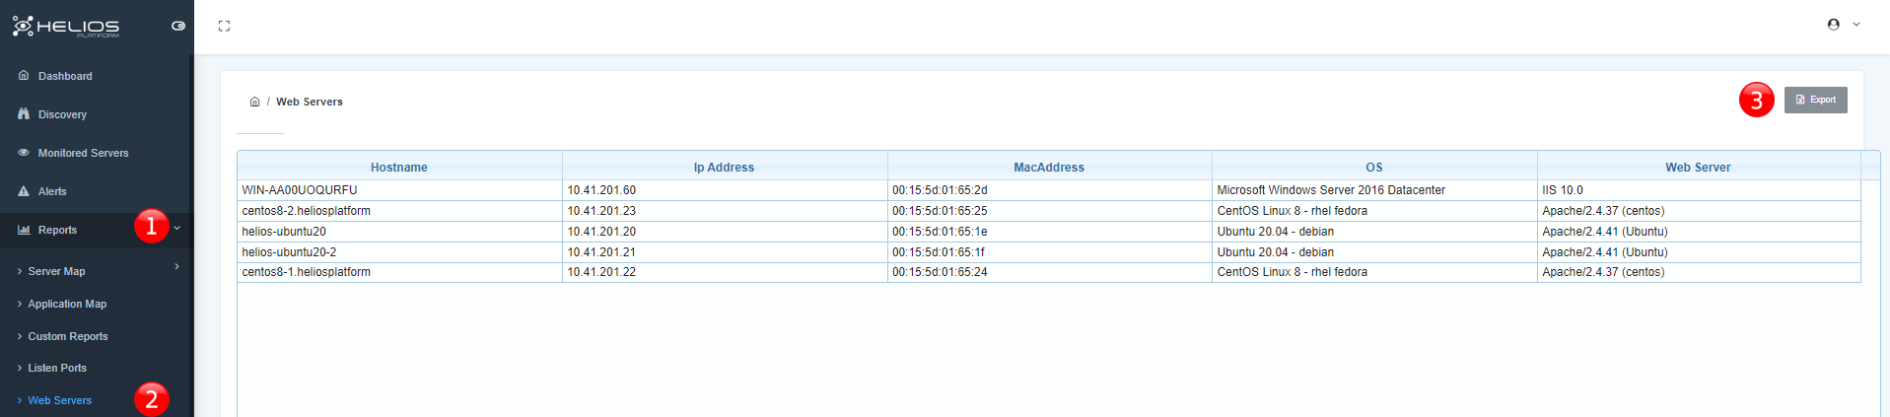
- Click to pass reports section.
- Click to web servers.
- Click to export web servers as excel format.
Database Servers
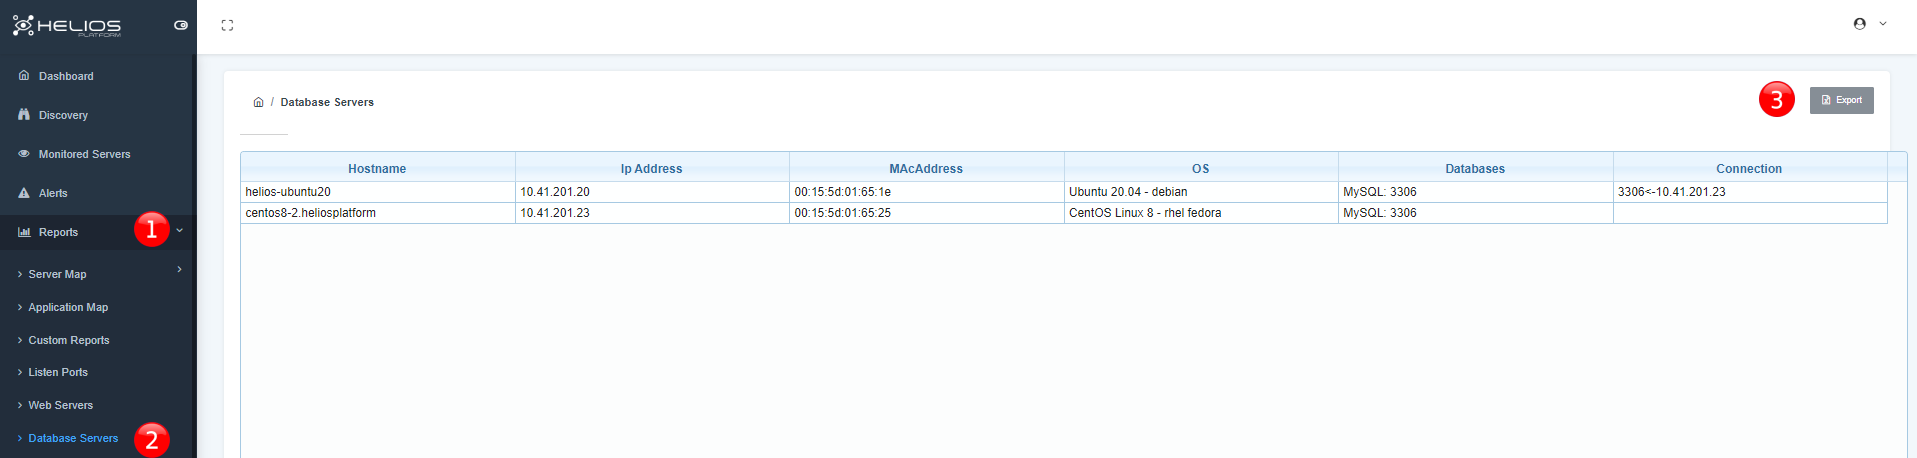
- Click to pass reports section.
- Click to database servers.
- Click to export database servers as excel format.
Server Inventories
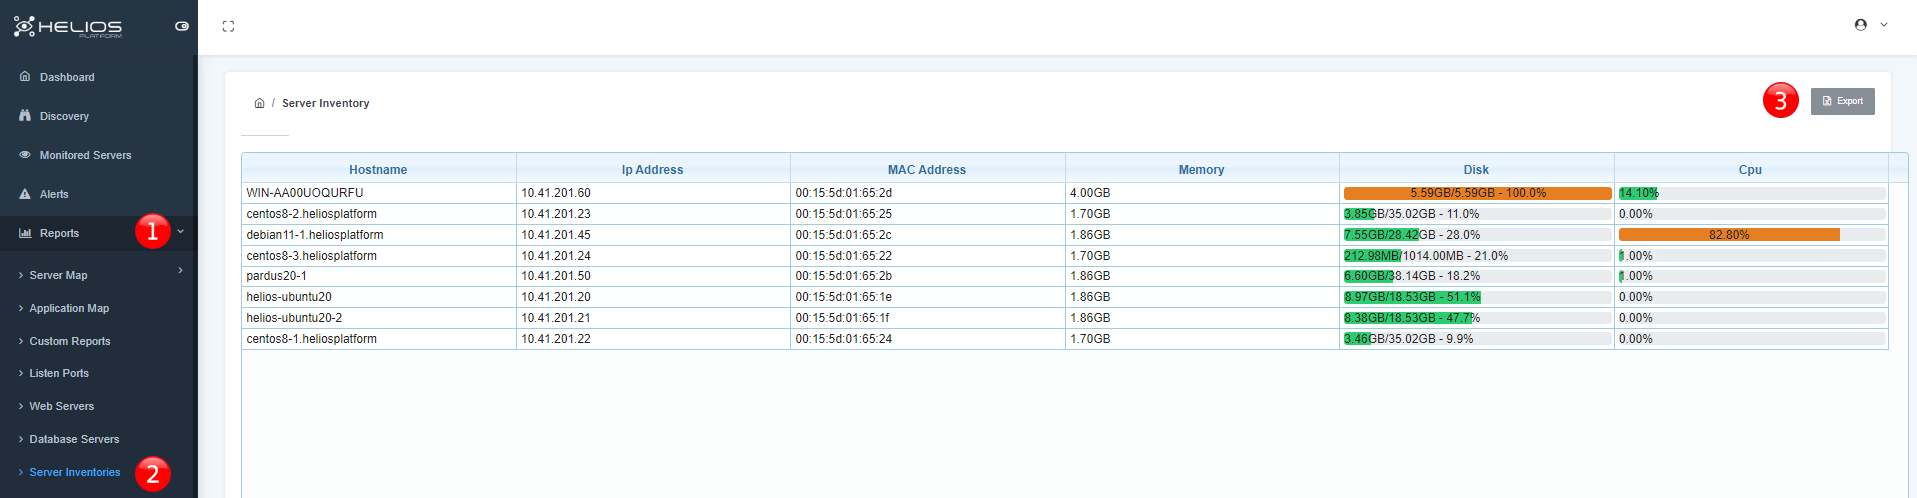
- Click to pass reports section.
- Click to server inventories.
- Click to export server inventories as excel format.
Disk Fullness
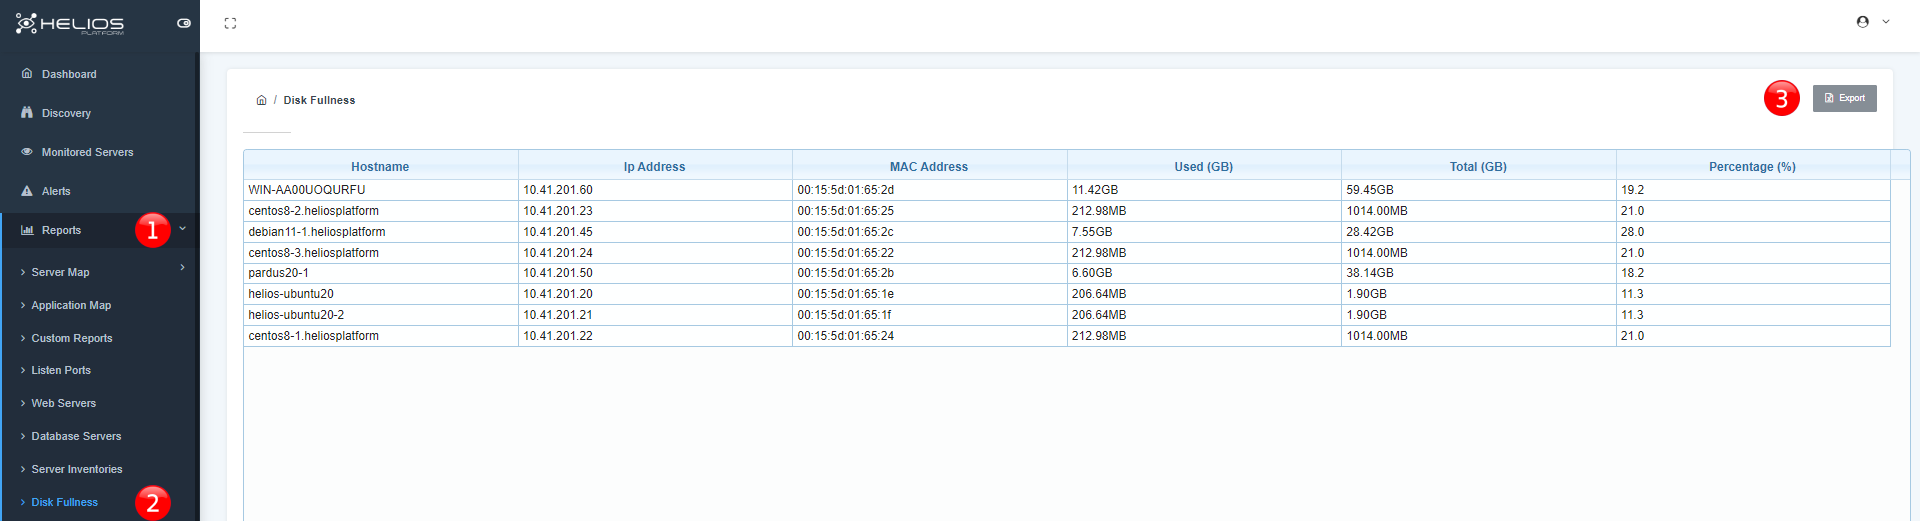
- Click to pass reports section.
- Click to disk fullness.
- Click to export disk fullness as excel format.
Alert Reports
- Click to pass reports section.
- Click to alert reports.
- Click to export alert reports as excel format.
Logs
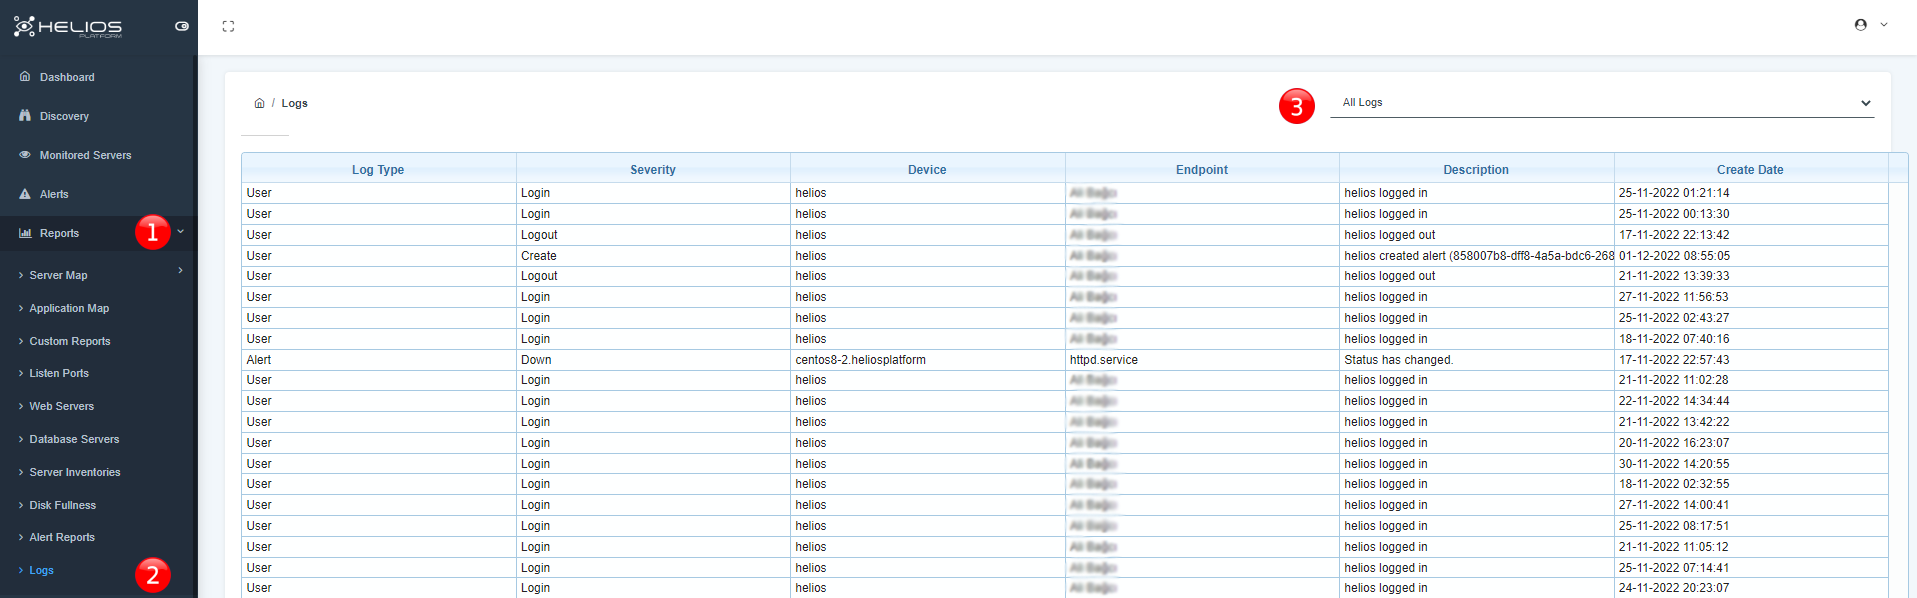
- Click to pass reports section.
- Click to logs.
- Click to select the type of log you want to see (all/user/alert/service)
Agent Installation
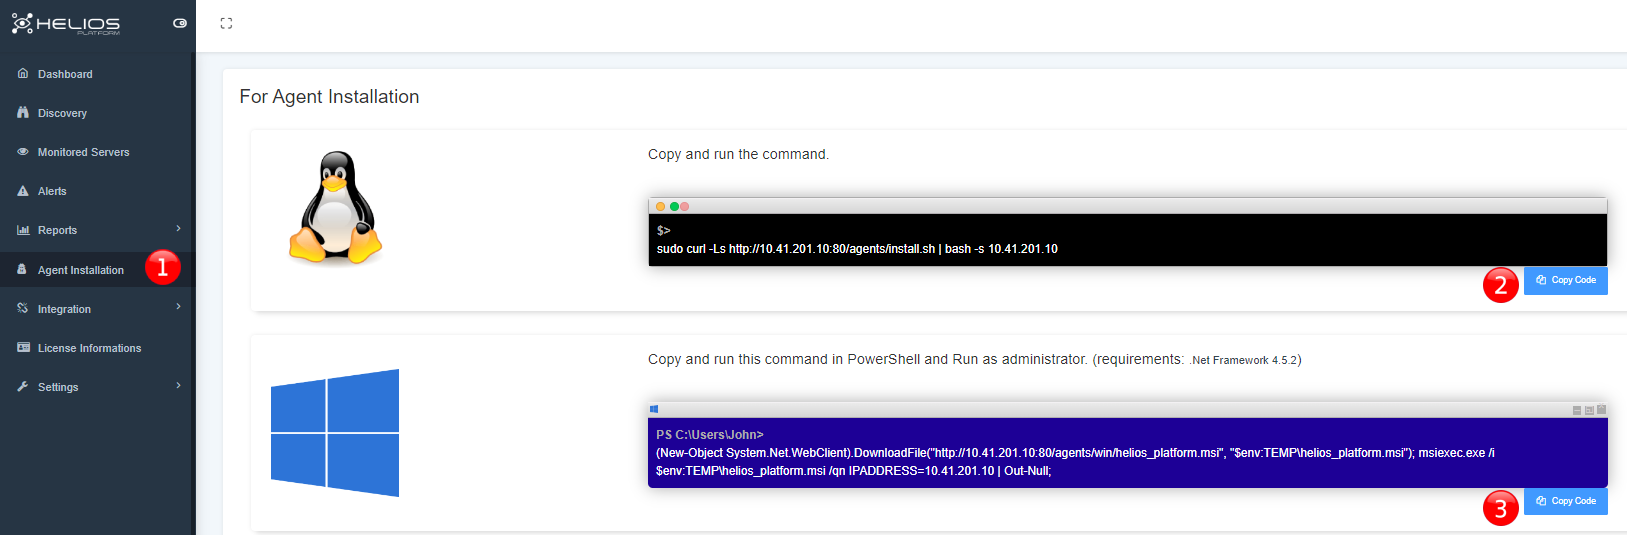
- Click to pass agent installation section.
- Click to copy button for linux systems.
- Click to copy button for windows systems.
Integration
Grafana API
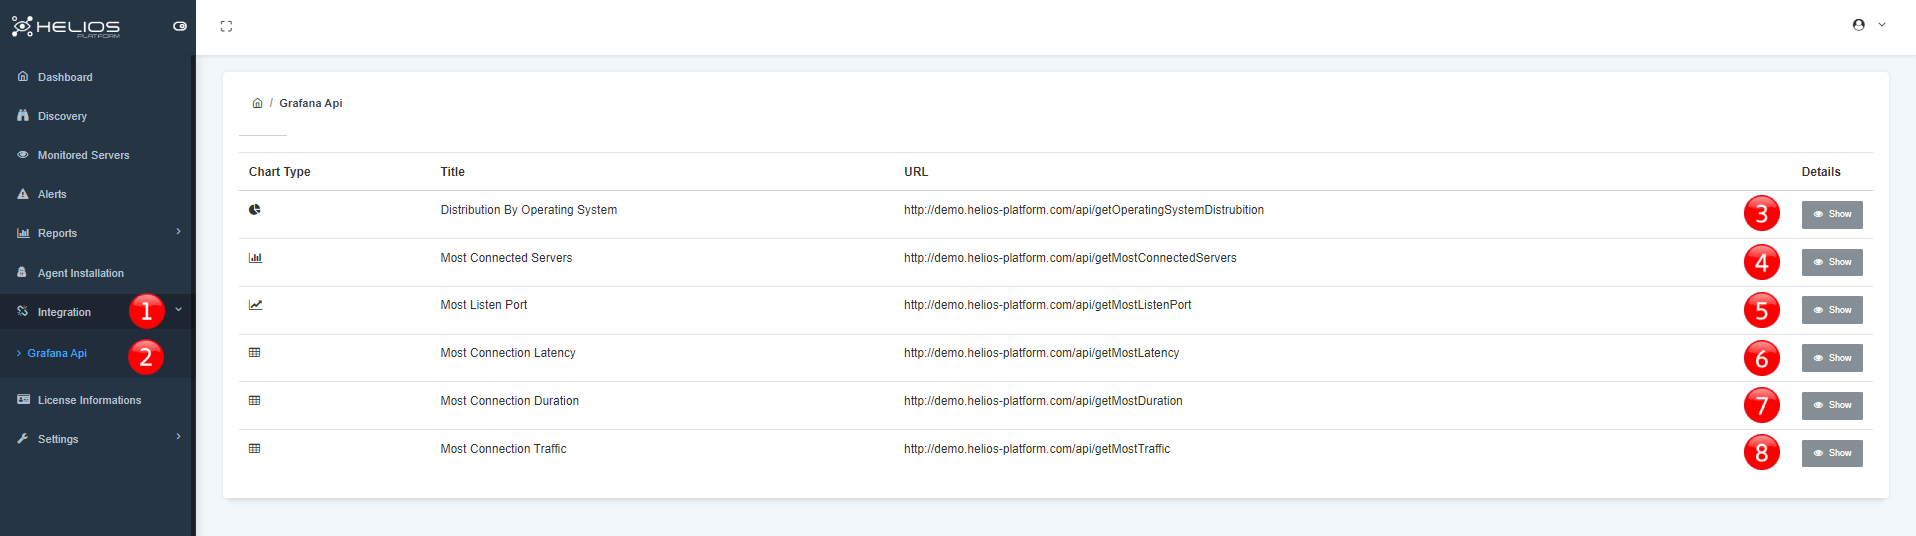
- Click to see Grafana API.
- Click to see Grafana API details.
- Click to show details of distribution by operating system.
- Click to show details of most connected servers.
- Click to show details of most listen port.
- Click to show details of most connection latency.
- Click to show details of most connection duration.
- Click to show details of most connection traffic.
Settings
Users
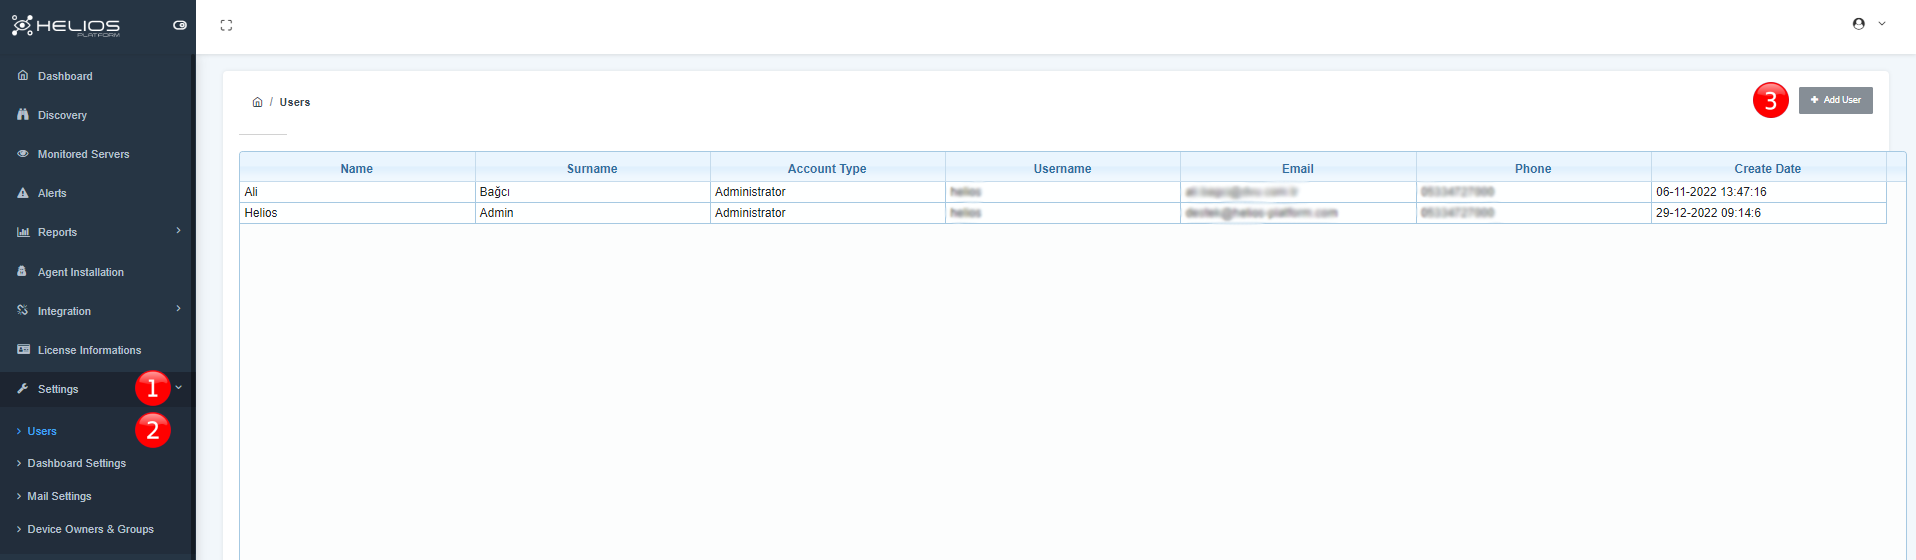
- Click to pass settings section.
- Click to pass users settings.
- Click to add user.
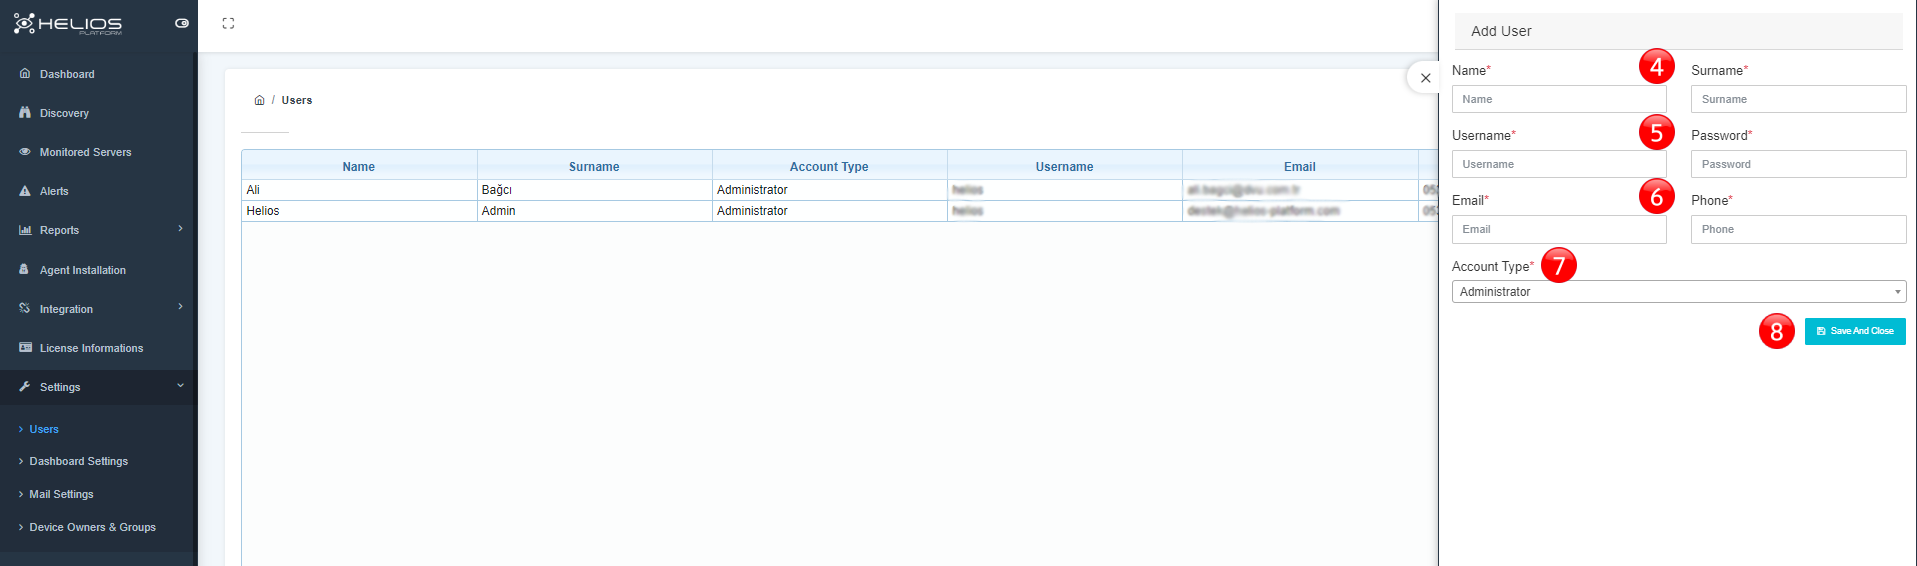
- Fill the personal information for user.
- Fill the user information.
- Fill the connection information.
- Choose the account type.
- Save and close.
Dashboard Settings
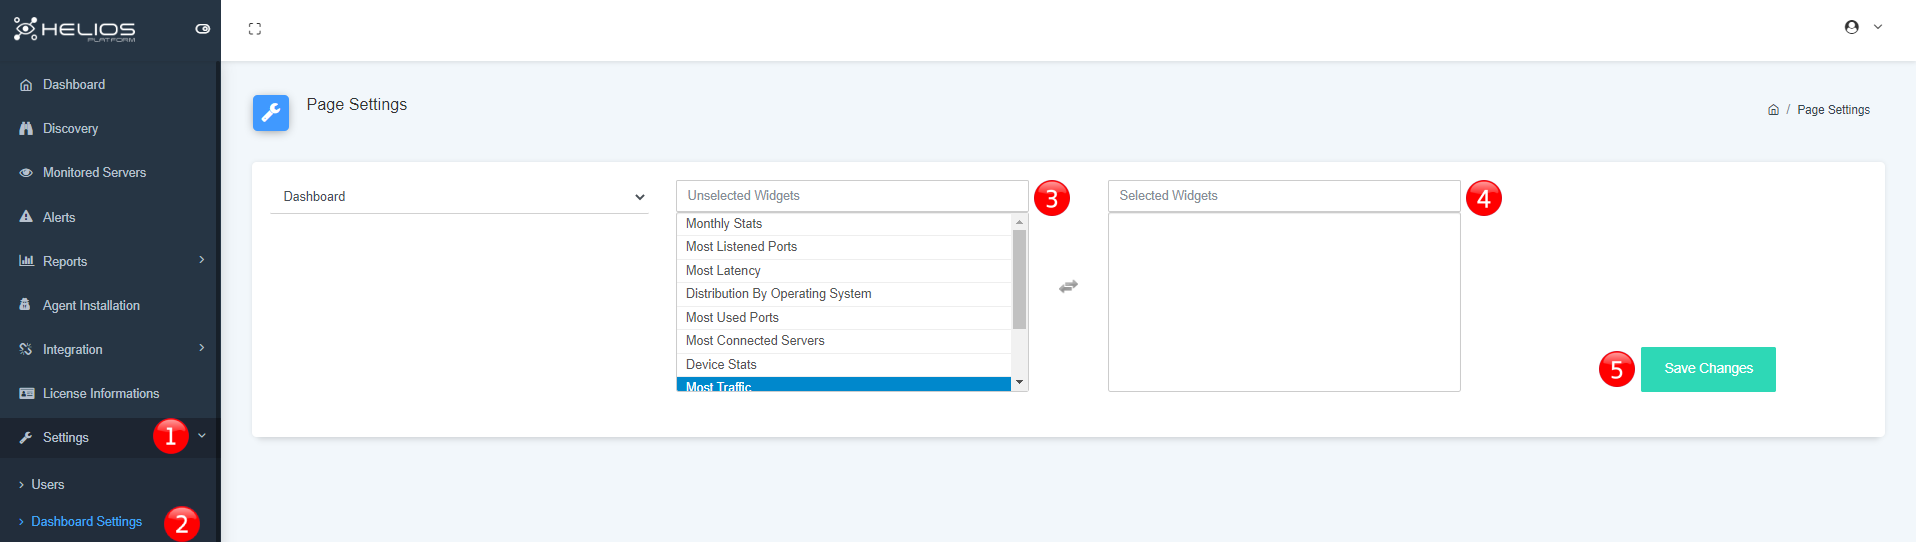
- Click to pass settings section.
- Click to pass dashboard settings section.
- You can choose what you want to see in dashboard section.
- Selected features appears in this area.
- Click to save changes.
Mail Settings
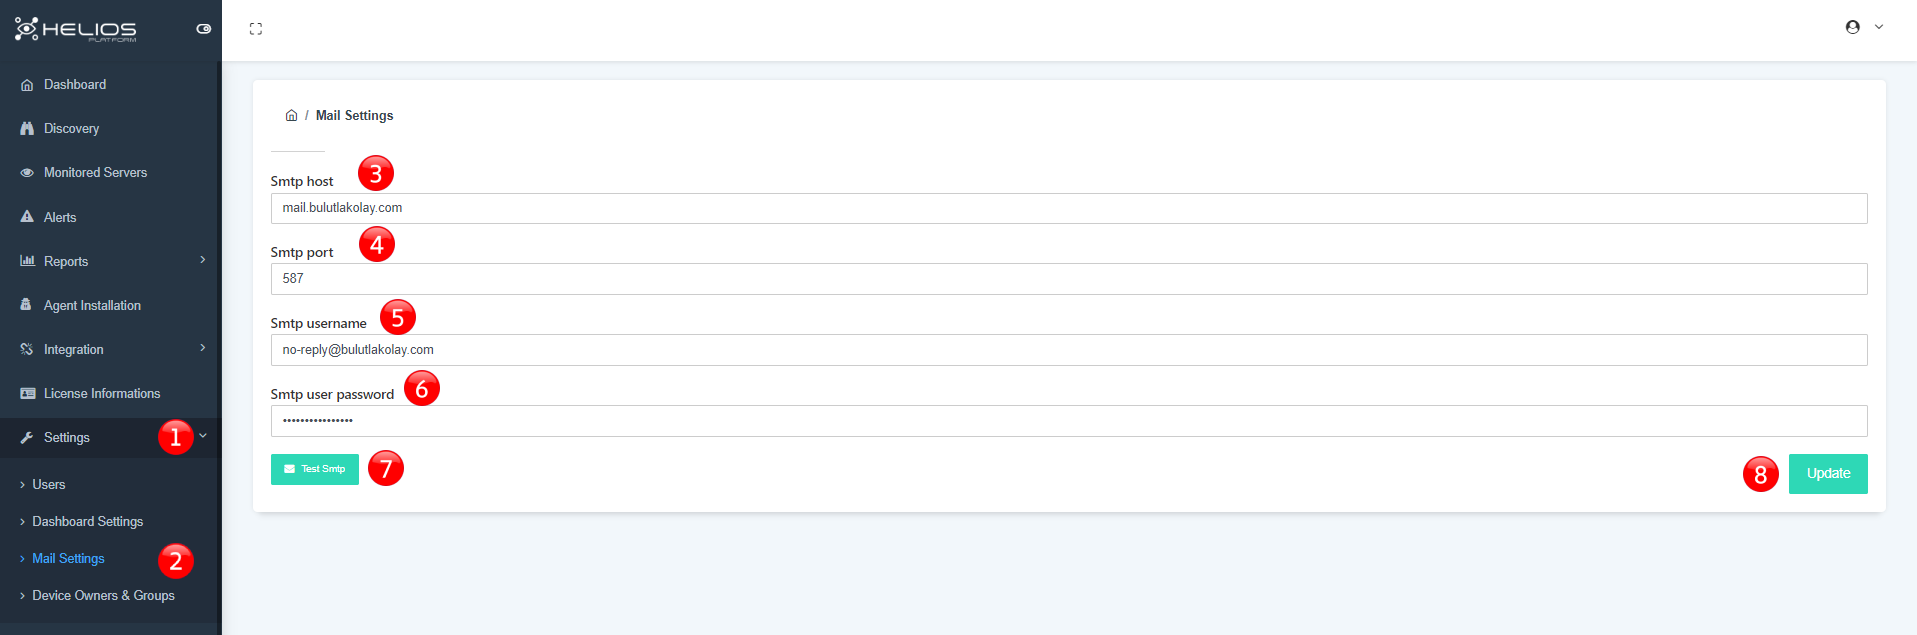
- Click to pass settings section.
- Click to pass mail settings.
- Set the host.
- Set the port.
- Set the username.
- Set the password.
- Send the test e-mail.
- Update changes.
Device Owners & Groups
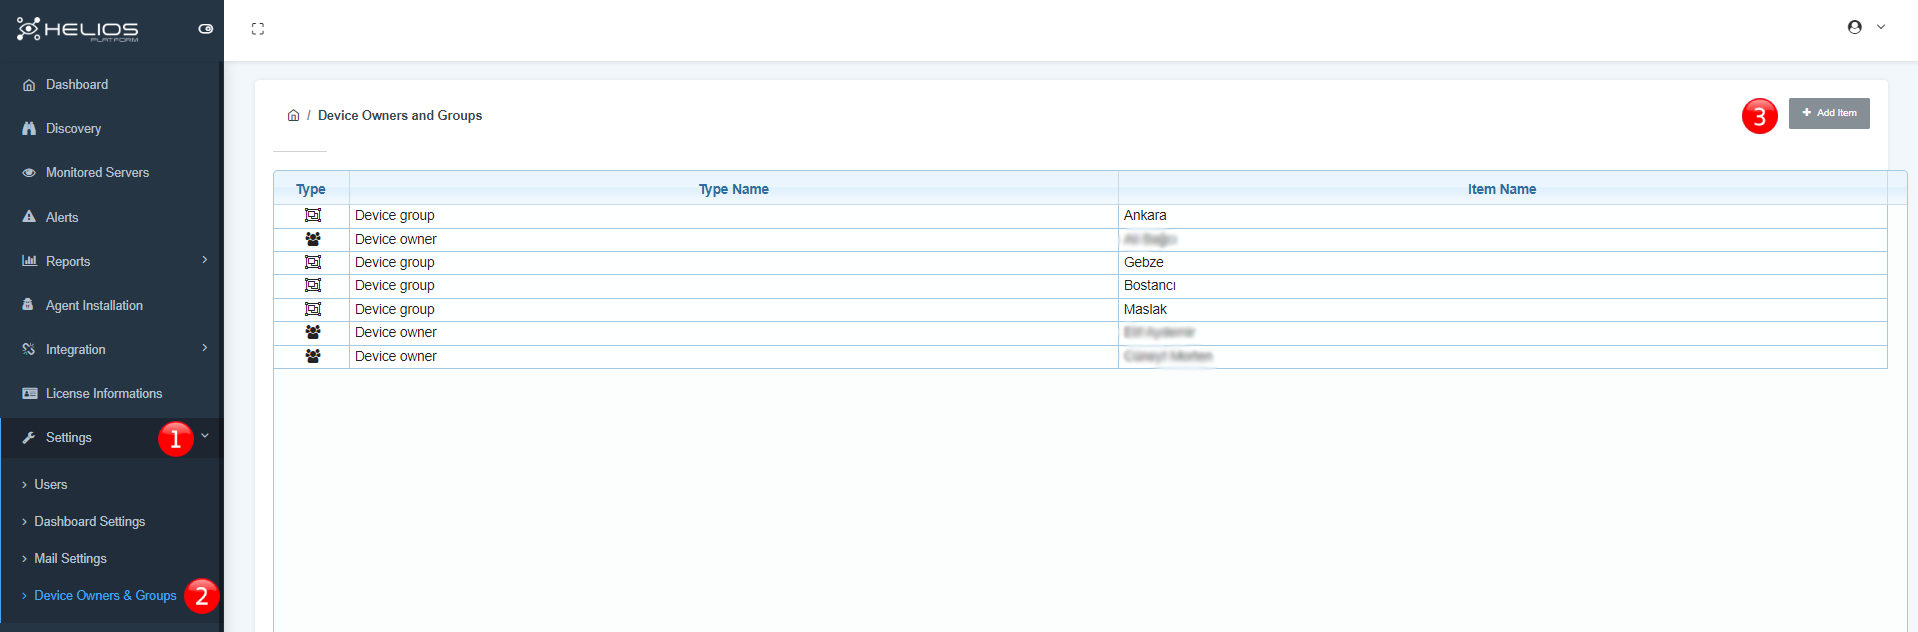
- Click to pass settings section.
- Click to device owners & groups.
- Click to add item.
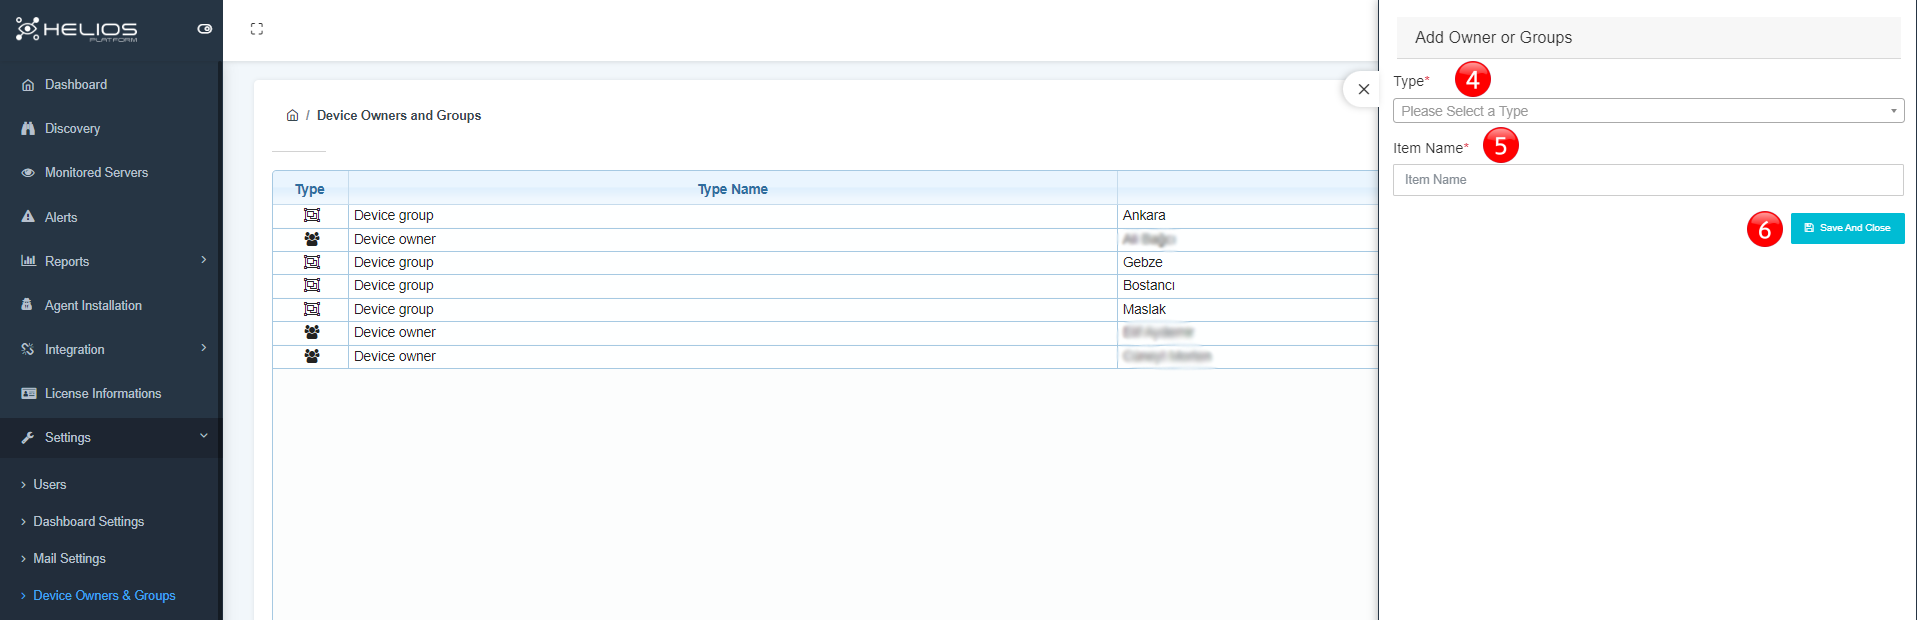
- Click to select a type.
- Set the item name.
- Save and close.