Integrations
Grafana
Grafana is a popular open source data visualization and monitoring tool used to display time series data from various sources.
It provides a flexible platform to create alerts and dashboards that can be used to monitor the performance of various systems, applications and infrastructure.
Attention
For grafana integration, after logging in to helios-platform, click on the Integrations/Grafana link from the left menu.
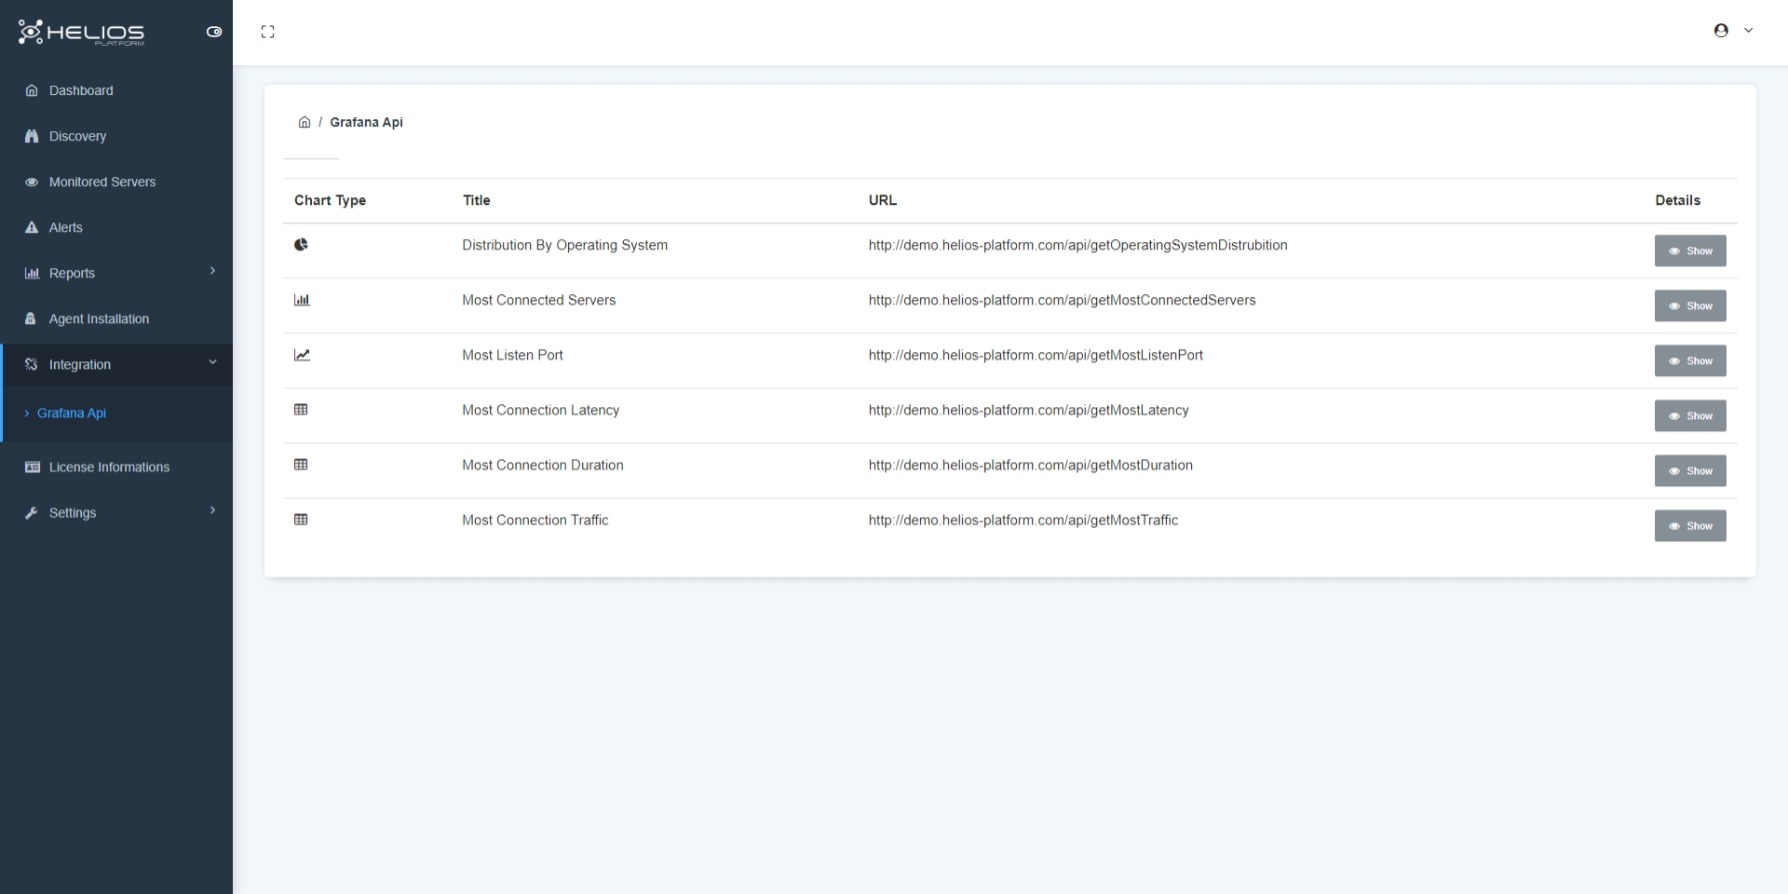
How to integrate Grafana?
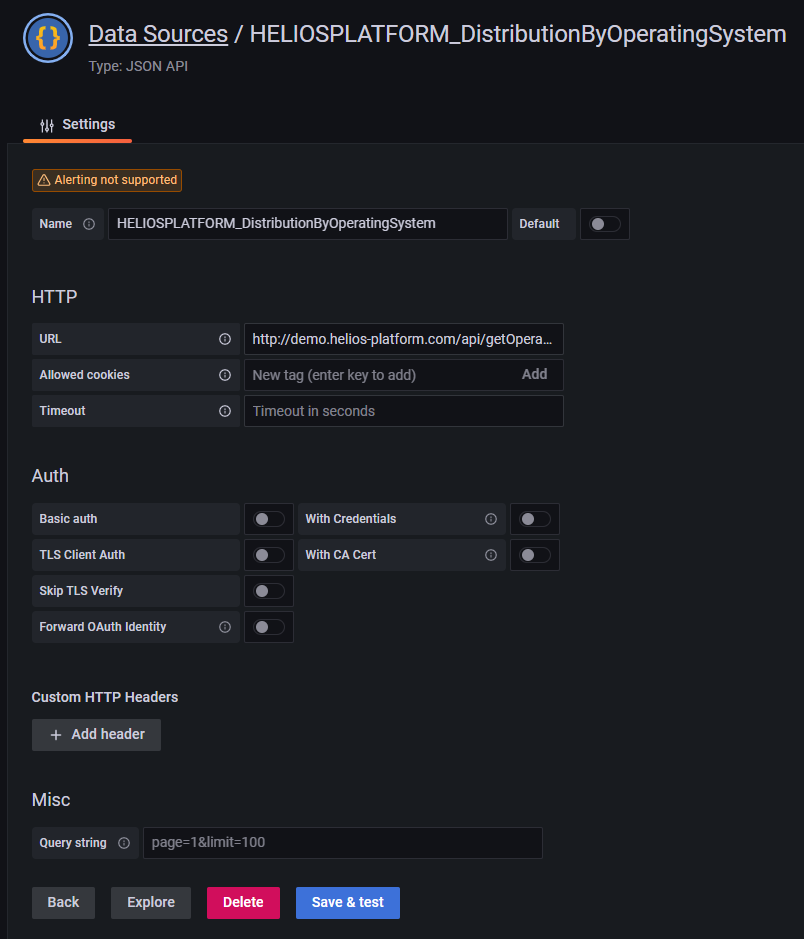
Step 1: You must create a datasource for each link.
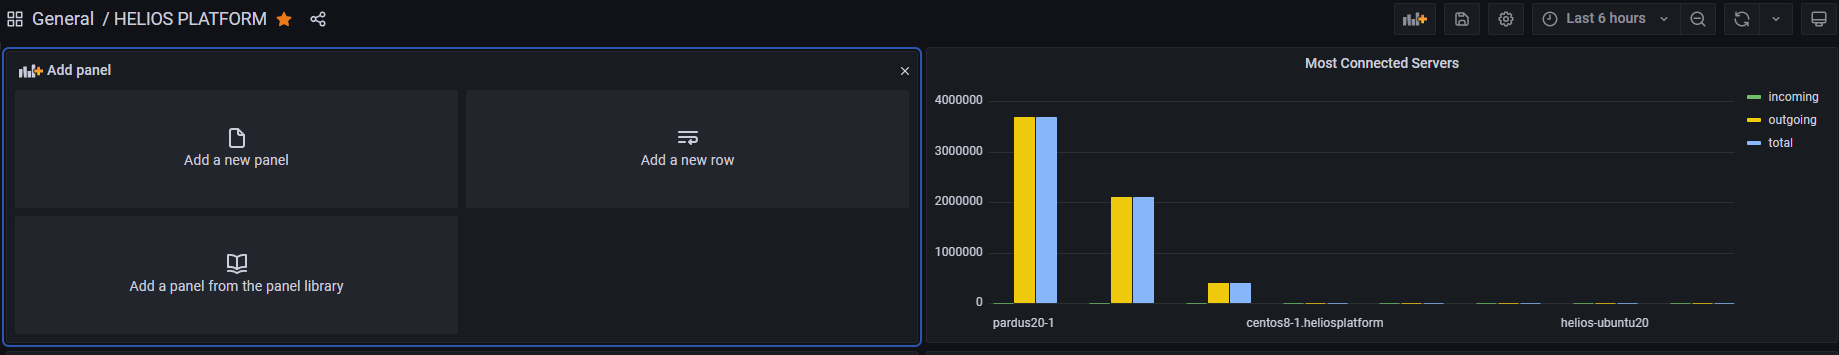
Step 2: Click the add panel button in the upper right corner of the dashboard and click the Add a new panel button from the widget that opens.
Step 3: On the page that opens, the datasource you created from the datasource section is selected, the data to be displayed in the field section is entered. Finally, the specified card type is selected from the card types in the upper right corner and the process is completed by clicking the save button.
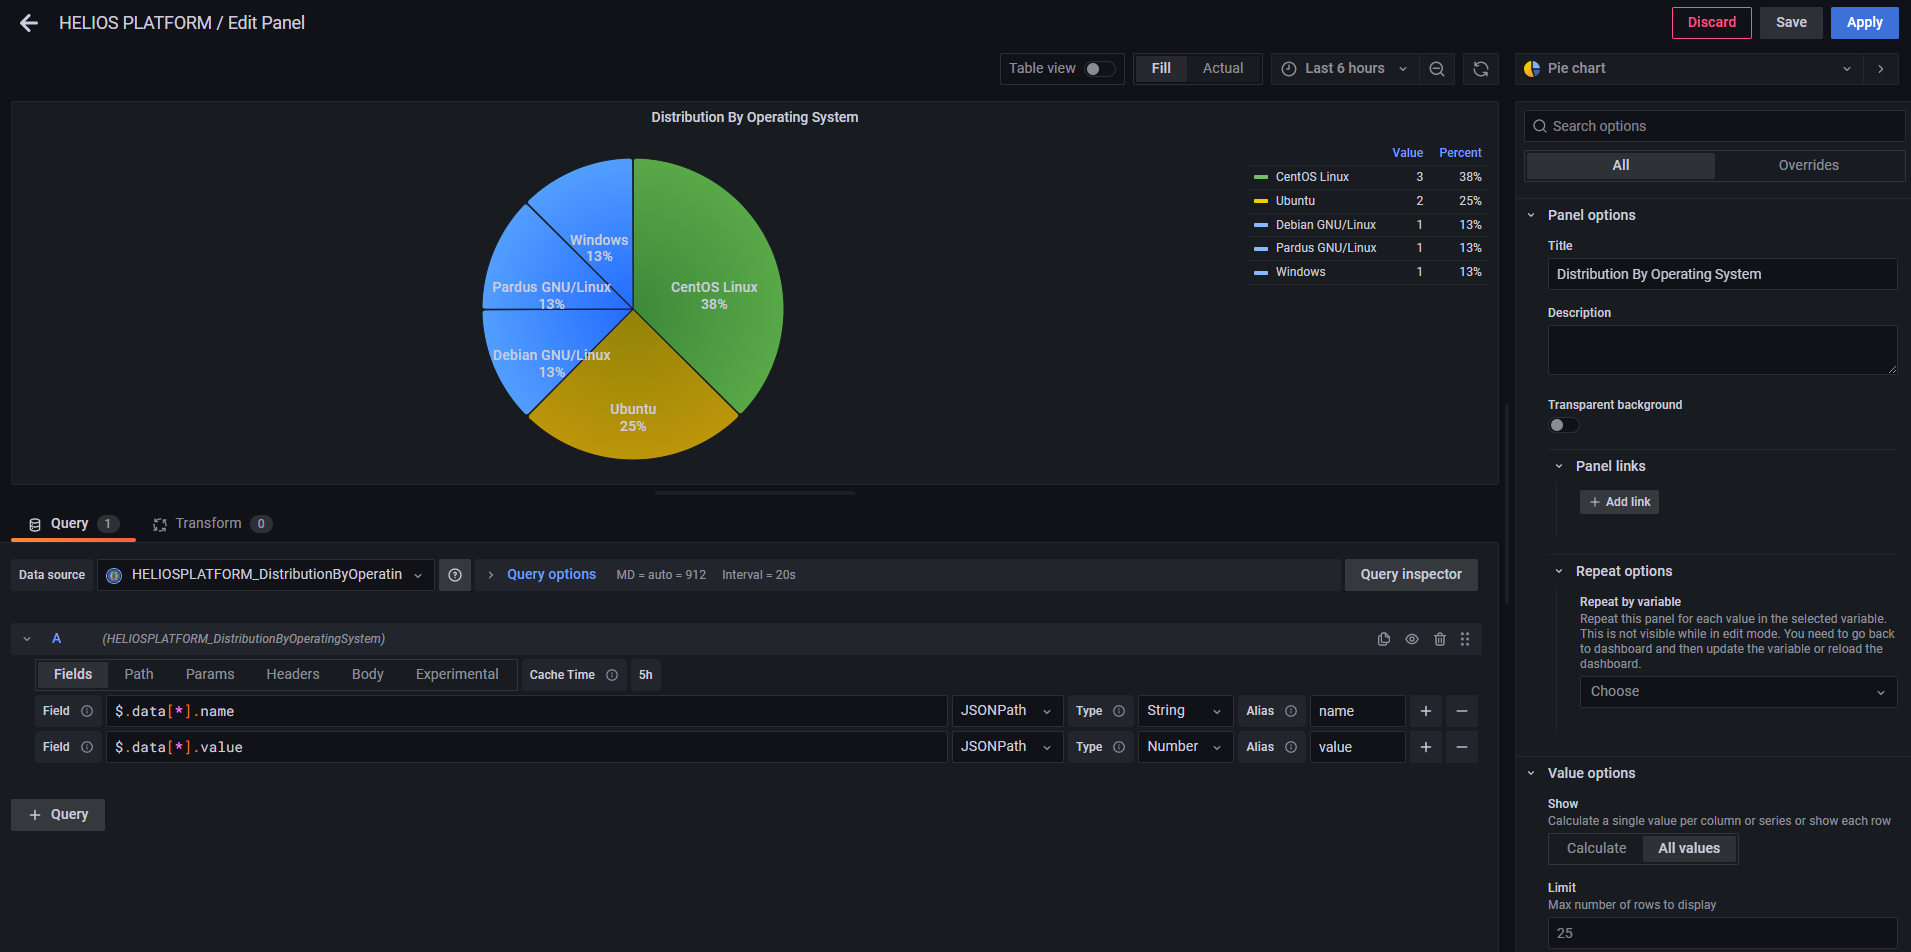
Distribution By Operating System
| Desription | Contains statistical data of operating system distributions |
| Api URL | http://<ip>:9739/api/getOperatingSystemDistrubition |
| Chart Type | Pie or Donut |
 {
 data: [
   {
      name: "string",
      value: "integer"
   }
 ],
 timestamp: "string"
 }
   {
     data: [
            {
                name: "CentOS Linux",
                value: 3
            },
            {
                name: "Ubuntu Linux",
                value: 1
            },
            {
                name: "Pardus GNU/Linux",
                value: 1
            },
            {
                name: "Windows",
                value: 1
            }
            ],
    timestamp: "18-01-2023 16:13:24"
}
Most Connected Servers
| Desription | It contains the information of the 10 most connected servers. |
| Api URL | http://<ip>:9739/api/getMostConnectedServers |
| Chart Type | Bar |
 {
 data: [
   {
      name: "string",
      incoming: "integer",
      outgoing: "integer",
      total: "integer"
   }
 ],
 timestamp: "string"
 }
   {
     data: [
            {
                name: "pardus20-1",
                incoming: 13,
                outgoing: 2608497,
                total: 2608510
            },
            {
                name: "WIN-AA00UOQURFU",
                incoming: 7,
                outgoing: 2101246,
                total: 2101253
            },
            {
                name: "centos8-1.heliosplatform",
                incoming: 15,
                outgoing: 2956,
                total: 2971
            },
            {
                name: "ubuntu20-1.heliosplatform",
                incoming: 33,
                outgoing: 803,
                total: 836
            }
            ],
    timestamp: "18-01-2023 16:13:24"
}
Most Listen Ports
| Desription | It contains the information of the 10 most listen ports. |
| Api URL | http://<ip>:9739/api/getMostListenPort |
| Chart Type | Stat |
 {
     data: [
     {
         name: "string",
         value: "integer"
     }
     ],
     timestamp: "string"
 }
   {
     data: [
            {
                name: "22",
                value: 7
            },
            {
                name: "80",
                value: 6
            },
            {
                name: "25",
                value: 3
            },
            {
                name: "21",
                value: 2
            },
            {
                name: "3306",
                value: 2
            }
            ],
    timestamp: "18-01-2023 16:13:24"
}
Most Connection Latency
| Desription | It contains the information of the 10 High Latency. |
| Api URL | http://<ip>:9739/api/getMostLatency |
| Chart Type | Table |
 {
 data: [
   {
     localaddress: "string",
     remoteaddress: "string",
     port: "string",
     direction: "string",
     itemTotal: "integer"
   }
 ],
 timestamp: "string"
 }
   {
     data: [
            {
                localaddress: "10.41.201.20",
                remoteaddress: "185.125.188.54",
                port: "443",
                direction: "out",
                itemTotal: 78376.02
            },
            {
                localaddress: "10.41.201.21",
                remoteaddress: "185.125.188.59",
                port: "443",
                direction: "out",
                itemTotal: 66631.5156
            }
            ],
    timestamp: "18-01-2023 16:13:24"
}
Most Connection Duration
| Desription | It contains the information of the 10 High Duration. |
| Api URL | http://<ip>:9739/api/getMostLDuration |
| Chart Type | Table |
 {
 data: [
         {
             localaddress: "string",
             remoteaddress: "string",
             port: "string",
             direction: "string",
             itemTotal: "integer"
         }
         ],
         timestamp: "string"
 }
   {
     data: [
            {
                localaddress: "10.41.201.20",
                remoteaddress: "185.125.188.54",
                port: "443",
                direction: "out",
                itemTotal: 78376.02
            },
            {
                localaddress: "10.41.201.21",
                remoteaddress: "185.125.188.59",
                port: "443",
                direction: "out",
                itemTotal: 66631.5156
            }
            ],
     timestamp: "18-01-2023 16:13:24"
    }
Most Connection Traffic
| Desription | It contains the information of the 10 High Traffic. |
| Api URL | http://<ip>:9739/api/getMostTraffic |
| Chart Type | Table |
 {
 data: [
         {
             localaddress: "string",
             remoteaddress: "string",
             rxCount: "integer",
             txCount: "integer",
             rxtxTotal: "integer",
             conCount: "integer"
         }
         ],
         timestamp: "string"
 }
   {
     data: [
            {
                localaddress: "10.41.201.20",
                remoteaddress: "10.41.201.23",
                rxCount: 407659,
                txCount: 21623,
                rxtxTotal: 429282,
                conCount: 14
            },
            {
                localaddress: "10.41.201.20",
                remoteaddress: "10.41.201.22",
                rxCount: 399896,
                txCount: 156,
                rxtxTotal: 400052,
                conCount: 4
            }
            ],
     timestamp: "18-01-2023 16:13:24"
    }